What really matters when swing trading, and what skills must one master to succeed?
Stock trading is straightforward but not easy, and when done effectively, it can often be considered "boring." Successful swing traders frequently spend 90% of their time waiting for ideal market conditions and only 10% of their time executing trades.
Swing trading requires discipline and the capacity to renounce the ego and accept market conditions, at every moment, for what they are, not what you want them to be. You must avoid being mentally linked to a desired market outcome.
Swing trading requires us to trade what we see, not what we think. As Ned Davis highlighted in his book "Being Right or Making Money," the goal is to make money, not to be "right."
Don't get caught up in proving that your view is correct and the market is incorrect since this is a formula for disaster that has turned many a short-term swing trade into a long-term "investment."
Having a disciplined daily pre-market routine allows one to remain confident, in control, and completely focused on the trading plan for the day ahead, regardless of prevailing market conditions. Author James Clear stated, "You do not rise to the level of your goals; you fall to the level of your systems."
At times of increasing price volatility and market stress, the simpler your system is, the better, so you observe, analyze, execute, and respond without thinking; you simply do.
As a swing trader, you must mentally block all distractions and disregard most of the social, political, and economic news, as it is completely unrelated to the task at hand.
Once you have identified and studied your chosen setup(s), what matters first and foremost is whether the market environment is conducive to swing trading along with the post-breakout price behavior of your stocks.
It is not necessary to foresee the future to profit from the stock market. It is frequently impossible and extremely challenging to predict correctly and to do so consistently.
Contrary to popular belief, prediction is not even required. What is required is a daily system that enables awareness of the current market environment and the dominant primary market trend. To accomplish the highest returns over time, it is essential to focus on the optimal 4 & 5-star setups.
You must always maintain high standards, wait for a market that best suits your swing trading style, and then be very aggressive when the time is right to trade when your edge is in play.
If market conditions aren’t favorable and quality setups are not to be found, then you don’t have an edge, and you must have the discipline to remain on the sidelines and await improved conditions.
Good swing trading periods occur in waves, two or three times a year, so remember you don’t always have to trade; you can watch and wait. Perhaps, as Jesse Livermore suggested, do a little fishing 🎣!
#Traders #SwingTrading #JesseLivermore
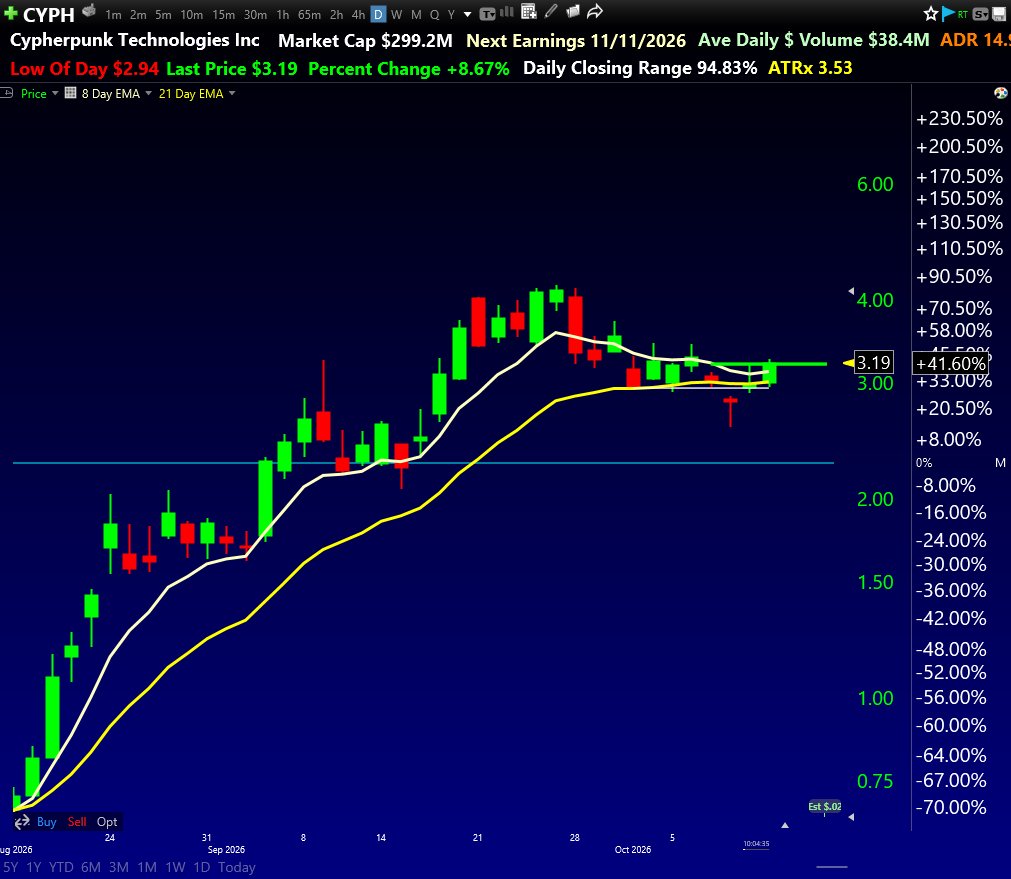
Copper is a leading indicator for Semis $SMH ever since 2020 low, arguably even longer.
Copper surged in Q1, shortly thereafter Semis went parabolic.
Copper is within pennies of a new all-time high. And I'm "just trying to make a💲out of .15cents, a Dime and a Nickel." (Tupak Shakur)
Semis on deck!
$SPY $SOXX $QQQ $COPP $FCX $XLB $NVDA $AM $MU $SKHY
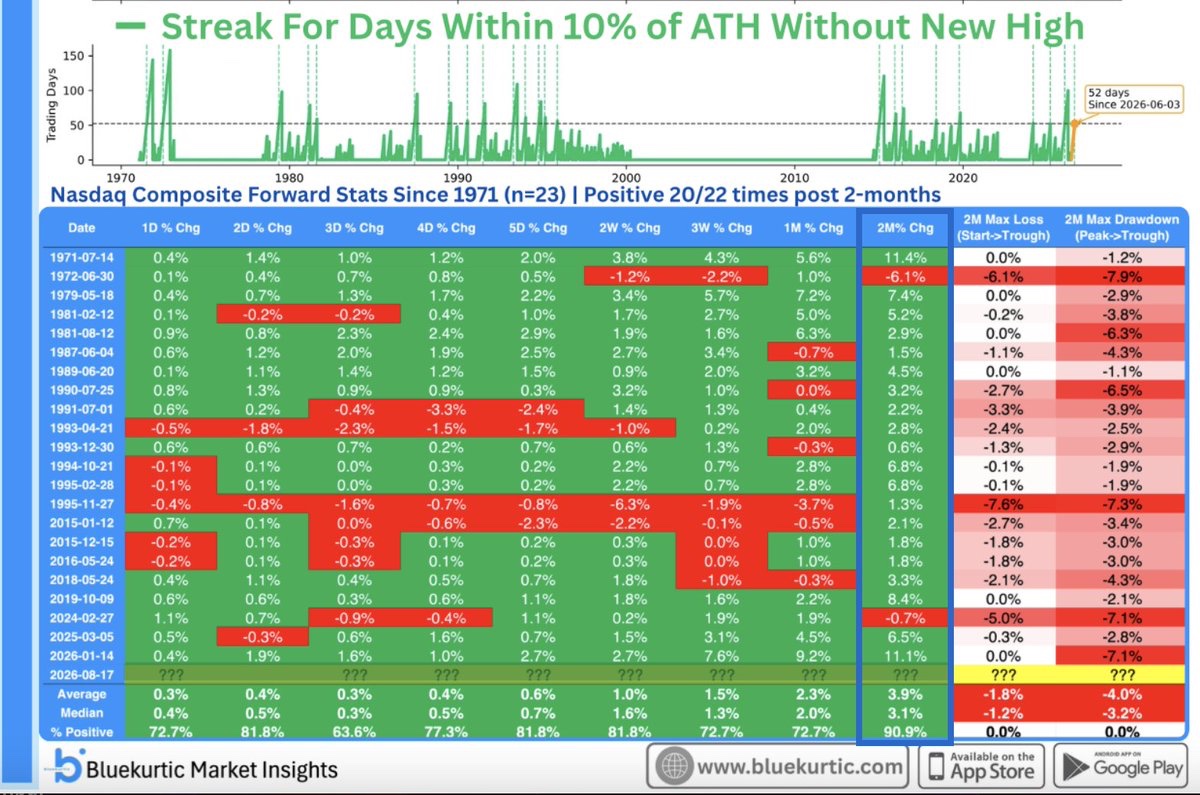
$COMPQ has stayed w/in 10% of its all time high w/out making new high for 52 trading days. Since 1971, this marks only 23rd such instance.
Nasdaq was positive 2 months later in 20/22 cases, a 90% positivity rate. Average return of ~4%.
$NDX $QQQ $SPY $SPX $VIX $TQQQ $MAGS $SPCX h/t @Bluekurtic
Master one setup at a time.
“I fear not the man that has practiced 10,000 kicks once, but I fear the man that has practiced one kick 10,000 times. – Bruce Lee.”
To succeed as a trader, you need to acquire the skills you "think" you have. When trading, learn how to master your "response-ability" so you can take full responsibility for your results. No excuses.
To succeed as a swing trader, you need to master 3 things:
1. When to trade—you must learn how to identify when the market is favorable for swing trading and when it's time to watch and wait (for as long as it takes). This is by far the most important skill to learn.
2. Your setup—you must select and master every aspect of your setup (e.g., continuation setup) and turn over your edge as often as possible during favorable market conditions.
3. Surrender to price—have no ego and accept every price as a unique moment in time. Remain open-minded to all potential outcomes and keep your process simple.
#SwingTrading #StockMarket
Over time, your average gain must be greater than your average loss. You need to clearly identify your expected return per unit of risk for the type of setup you trade and then turn over your edge as frequently as possible (e.g., 2.5% risk making a 10%+ return) during favorable market conditions.
Try to remember that a single trade doesn't really matter, so remain poised and take a profit or loss without emotion.
In the business of speculation, what does matter is the positive expected value of the long-run average of thousands of trades.
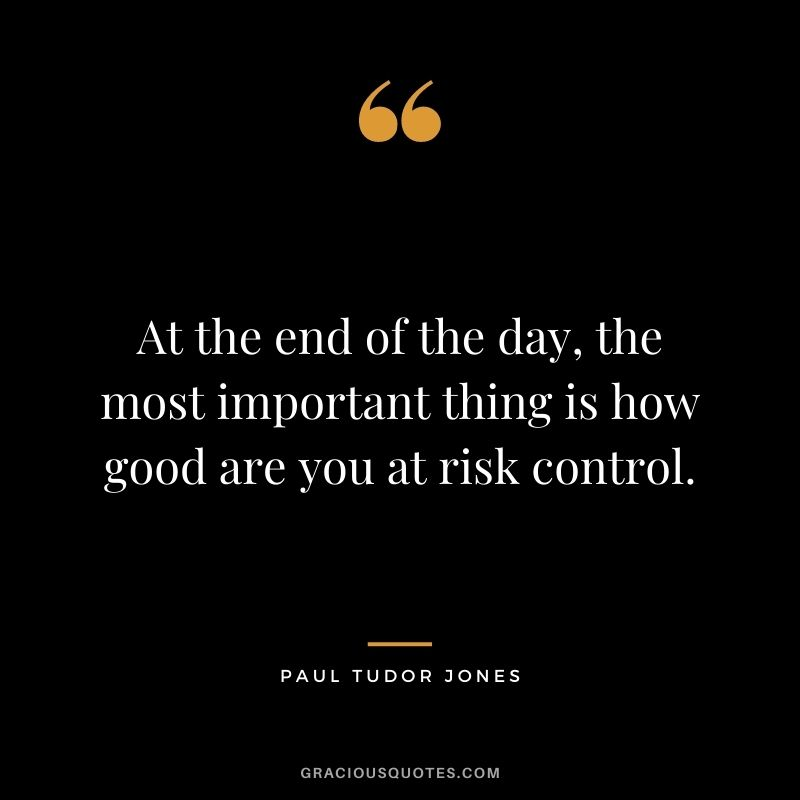
Risk management is like oxygen in the arena of speculation, its life or death, so commit right now to never taking a large loss when trading.
To succeed as a swing trader, think of yourself as a professional loss taker doing a normal part of your job.
The anticipated expected value of a random variable is just its long-run average.
That random variable in trading is the profit or loss of a single trade on any given day.
Being "wrong" and getting stopped out is at the heart of stock trading.
George Soros described it best when he said, “It's not whether you're right or wrong that matters, but how much money you make when you're right and how much you lose when you're wrong.”
To succeed as a swing trader, think of yourself as a professional loss taker doing a normal part of your job.
#RiskManagement #StockMarket
As a trader, you must understand what you control.
You have total control over what, when, and how much you buy and sell. That’s it, nothing more, so avoid attempting to predict where a stock will move after you complete a trade, how much profit you will earn, and how frequently you will make it.
You must completely accept the risk of the trade before execution, then follow your operating system without fear, doubt, or hesitation.
I can’t emphasize this enough: you must have poise as a trader, visualize, and truly believe in yourself and your process that you will succeed 🏆.
#SwingTrading #Traders