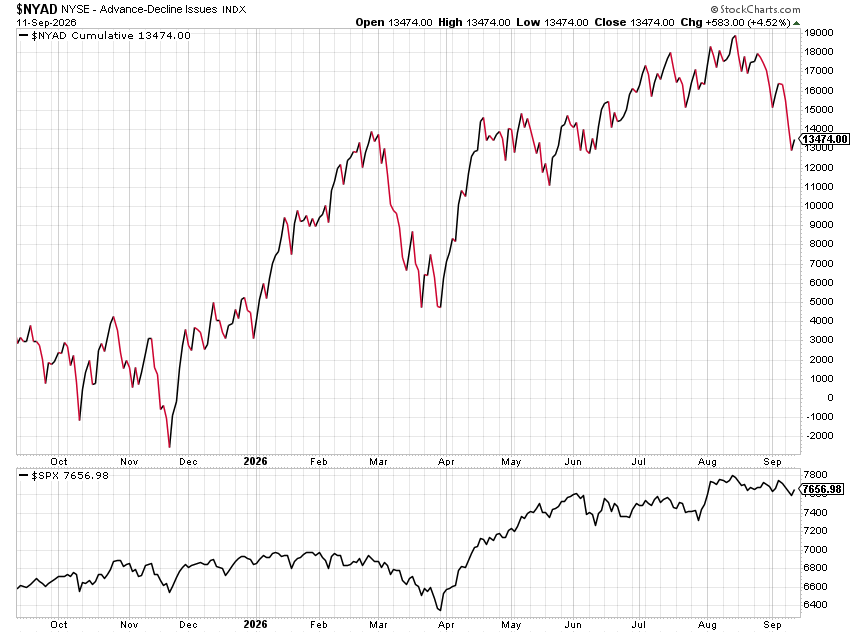
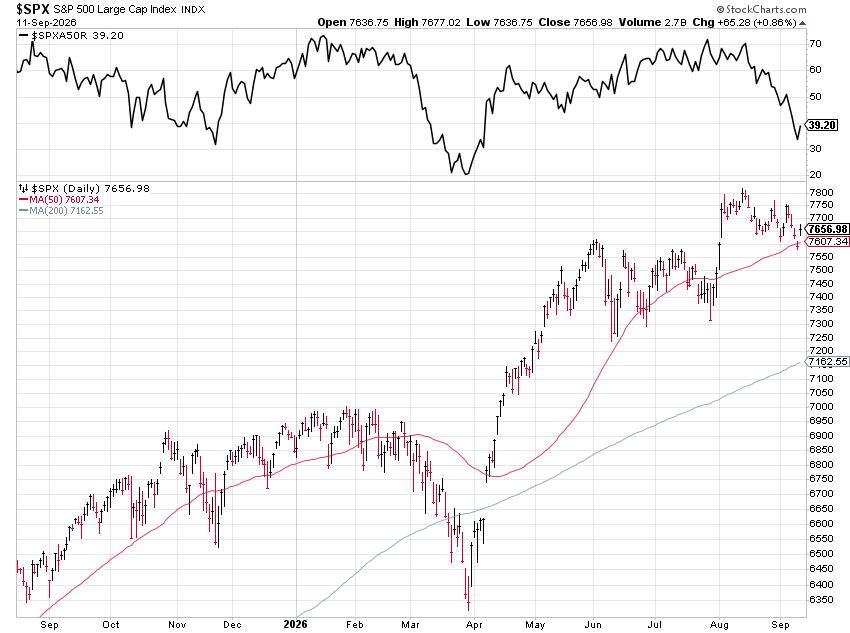
September is historically the market’s most difficult month, and this year we entered the period with another significant headwind: rising interest rates and oil prices. Yet the major averages held up relatively well in the face of a surge in both last week.
What we may be witnessing is more of a rotational correction and consolidation beneath the surface. The S&P 500 can appear relatively healthy while a large percentage of its individual components are already experiencing corrections.
The breadth statistics illustrate this divergence. As recently as mid-August, roughly 69% of S&P 500 stocks were above their 50-day moving averages. By September 11, that figure had fallen to roughly one-third of the index. On September 9 alone, 383 of the 500 S&P stocks were declining, while decliners outnumbered advancers by nearly 3-to-1 on the NYSE.
That's considerable internal deterioration without a comparable collapse in the headline index. In fact, from August 18 through September 8, the S&P 500 declined only about 0.2%, even as broader measures of participation deteriorated substantially.
We may already be experiencing a stealth correction—one stock and one group at a time.
With September historically the weakest month of the year, we still need to respect the seasonal risk, particularly with interest rates on the rise and elevated oil prices.
But if the indexes can hold together while individual stocks complete their corrections and begin rebuilding technically, the market could emerge from September in considerably better shape than the major averages alone would suggest, and the historical tendency then shifts to a strong year end rally.
The key is patience; to wait for proper setups and not let the indexes pressure you into sub standard trading decisions.
The real story right now may not be what the S&P 500 is doing. It's what the stocks beneath it have already done and are currenty doing.
We are seeing a very sharp rotation beneath the surface today, with the selling concentrated in the areas that have been at the center of the AI infrastructure trade. The Nasdaq opened down roughly 1.2%, but the damage is considerably worse across semiconductors and AI-related hardware. MRVL, MU and INTC were down roughly 6% or more early, LRCX was hit around 8%, and NVDA fell more than 3%. The weakness is global, with ASML and major Asian semiconductor names also under significant pressure.
The immediate catalyst is a weekend push from several prominent AI leaders—including Anthropic's Dario Amodei, Sam Altman and Elon Musk—calling for greater restraint in the pace of frontier AI development. Investors are extrapolating that into the possibility of a slower AI capital-spending cycle, which directly challenges the earnings narrative supporting semiconductors, memory, networking and data-center infrastructure.
What's particularly interesting is that this isn't simply broad risk-off selling. Money appears to be rotating within technology itself. While chips and AI infrastructure are getting hit, cybersecurity names are showing relative strength.
Bottom line: this looks like more than an ordinary down day in tech. The market is aggressively questioning one of its most crowded leadership themes while simultaneously searching for new sponsorship elsewhere. The key now is whether AI infrastructure stabilizes quickly—or whether today's action marks the beginning of a more meaningful leadership transition. https://t.co/JXzFFTmMtn
What Quant500 actually does, in under a minute.
Every S&P 500 company scored on momentum, value, quality and growth. Twenty model portfolios with fifteen years of walk-forward. Insider filings the day they land. A simulator to build your own rule.
Free, no account, no ads — and the drawdowns are published too.
https://t.co/WCPBMHbkIq
¿Estamos muy cerca de ver la revolución de las small caps?
Históricamente, las grandes revoluciones las lideran las grandes compañías, pero justo después se genera un enorme rally en las pequeñas empresas.
🚨 BREAKING: GOOGLE'S AI CAN NOW READ A STOCK CHART BETTER THAN MOST 5-YEAR TRADERS.
Screenshot any chart. It finds the support, the resistance, the pattern, the trend. In seconds. For free.
Here's how to turn Gemini into your personal chart tutor 👇
HOW TO MAKE $1,000,000 SWING TRADING
This is the 5 step process:
1. Find the sector ETF showing the most relative strength
Example: $IGV -> Software
2. Chart the ETF’s top holdings
3 Find the stocks leading the sector $CRM $PLTR
4. Wait for the 8/21 EMA cross
5. Enter the leaders on the break + retest
This is the blueprint. Use it.
Most breakouts fail because the quality of the previous 2-7 candles are not conducive for a successful breakout
Study past winners.
Study what the stocks looked like before they broke out. Then, develop a checklist and apply it to your system!
Here's are the some Real world Examples
This is a webinar output between Mark Minervini and David Ryan discussing what separates consistently profitable traders from everyone else.
1. The Three Non-Negotiable Rules
Mark starts with the three rules
-No forced trades
-No big losses
-Never average down ("Losers average losers")
His point is that most trading mistakes come from breaking these simple rules
2. Trading is About Process, Not Prediction
They argue that professionals don't predict markets,they:
-Wait patiently for setups
-Follow predefined rules
-Accept small losses immediately
-Never trade out of boredom
-Trading system exists primarily to remove emotion.
3. Timing Matters
Contrary to "you can't time the market," they believe timing is essential.
Timing comes from:
-Chart patterns
-Bases and consolidations
-VCP (Volatility Contraction Pattern)
-Volume drying up before breakout
-Buying as demand returns
The objective is to buy just as a move begins, not after everyone notices it.
4. Risk First, Returns Second
Professional trading means:
-Taking very small risk
-Seeking large gains relative to that risk
-Compounding repeatedly
Minervini points out that during his 155% U.S. Investing Championship year he was invested only about half the time.
Cash is a position.
5. The Four Drivers of Exceptional Performance
They repeatedly return to four ideas:
-Timing
-Portfolio turnover
-Concentration
-Risk/reward management
Those four together not stock picking alone produce superior returns.
6. Turnover Isn't Bad
Minervini says against the idea of "buy and hold forever."
Instead:
-Lock in gains
-Rotate into better opportunities
-Ignore tax considerations when making sell decisions
He'd rather pay taxes on profits than avoid taxes by holding losers.
7. Concentrated Portfolios
If you have an edge:
-Concentration increases returns.
-Diversification limits upside.
8. Progressive Exposure
One of Minervini's strongest ideas.
He never jumps from cash to fully invested.
Instead:
-Start around 25%
-Increase only if trades work
-Scale back immediately when they don't
This naturally makes you biggest during bull markets and smallest during difficult periods.
9. Protect Capital Aggressively
Several techniques are discussed:
-Move stops toward breakeven after confirmation
-Exit quickly if the trade behaves abnormally
-Rebuy if the setup forms again
-Leave ego out of trading
-Being stopped out is not failure,it simply means waiting for another opportunity.
10. Sell Into Strength
Instead of waiting for obvious weakness:
-Trim into sharp advances.
-Reduce positions as stocks become extended.
-Avoid giving back large gains.
-Professionals distribute into strength while amateurs become more optimistic as prices rise.
TradingView topluluğuna söz verdim: tamamen açık kaynak, tamamen ücretsiz. Ve sözümü tuttum, bugün platform trending listesinde #8'iz.
Ama bu sadece başlangıçtı.
POC, VAH, VAL, imbalance, delta…
Hepsini biliyorsunuz. Peki şunu sorayım:
Overbought ve oversold yapıyı daha önce bu kadar net görebildiniz mi?
Ben görmedim. Gördüyseniz yorumlara bırakın.
Görmediyseniz… birkaç saate sizinle.
https://t.co/86sS9nlKjZ
Deniz Sabancı
Some of the most compressed charts right now and mostly not in Fintwits' sight.
- 3%+ ATR
- above 21ema
- sufficient 20D RVOL
- < 4 xATR from 50SMA.
$FIGS $OMDA $BOX $DUOL $BAX $VERX
The more you trade, the more you learn.
The more you learn, the less you trade.
The less you trade, the more you understand the value of patience.
Eventually you realize:
The goal was never to trade more
It was to understand your edge well enough to know when NOT to trade.
You're using TradingView and Zerodha at 10% of their power.
Six tools that find the winners and manage your risk for you are switched off right now. You've never turned them on.
Turn these 6 on 👇
(🔖 Save this)
Hoy los mercados dan una señal de compra interesante. En el caso del SPX luego de un stop de ganancias en 7698, hoy da una re-entrada larga en 7680. Con miras a nuevos máximos históricos en 7860 al menos.
No es recomendación, solo les comparto lo que veo.
🚨 ÚLTIMA HORA: Google Gemini ahora puede analizar cualquier acción como un analista de Wall Street (gratis)
Aquí tienes 8 increíbles prompts de Gemini que reemplazan las terminales de Bloomberg de 4.000€ al mes:
[Guardar para más tarde 🔖]
Here's a note I just sent out to my clients:
The U.S. market remains in an uptrend, but the character of the advance is becoming increasingly complicated. The follow-through-day rally is now testing what I consider its last meaningful line of defense, while several major catalysts are converging at the same time. NVDA earnings, PCE inflation data, Jackson Hole, and a series of important software reports all have the potential to change the market narrative quickly.
The follow-through-day pullback needs to hold here. SPY 760 is the logical line in sand—a break below that level would constitute an FTD failure and add pressure to the technical picture.
There are plenty of catalysts that could force or settle the issue. NVDA, PCE, Jackson Hole and several important software earnings reports all hit this week. Any one of them could change the current narrative quickly.
The bigger-picture risk remains a potential regime change toward financial repression, which historically tends to emerge alongside financial stress. The massive amount of capital being committed to AI infrastructure is an obvious area to watch. NVDA and the roughly $500 billion alternative-asset financing story have become the market's best guess for where the epicenter of the next financial problem could develop if the AI/datacenter boom runs into trouble. Anti-datacenter sentiment is also building and could intensify heading into the midterms.
Jackson Hole could provide more clarity on the Fed's function, but regardless, hard assets are back on the radar. GLD, SLV and COPX continue to show strength.
Software looks to be transitioning from a laggard rally to potential leadership. PLTR has shown some recent power, which could be a tip off of a rotation from semiconductors into software. Several software companies report this week, so we should get more evidence very soon.
Bottom line: The uptrend is still intact, but the FTD needs to hold here. More importantly, individual stock setups need to proliferate. With major catalysts directly ahead, there's no reason to anticipate. Let the market show its hand.
We're becoming more selective, cutting names that aren't acting right and improving stops on open positions. If SPY 760 holds and new leadership develops, the rally has room to continue. If it fails, we respect the message and adjust accordingly as we head into a seasonally weak September.
https://t.co/JXzFFTmMtn
Here is a full breakdown of my EOD swing trading system that:
- Gave me 100%+ years since 2020
- Averages +50% CAGR since 1995 (based on 13k signal database)
- Entering breakouts EOD (2-min before the close),
- and trade 20min/day, with no discretion, and no stress
I will use an example of a trade I closed yesterday in $BMY, following the 5 steps in the pic attached.
---
Step 1:
The first thing to trade momentum breakouts is to find stocks that made a new, fresh leg higher and established a new trend.
I use the 50 EMA cloud (with 0.5 ATR 5 period above and below) as a base, when the market prints a strong first leg coming from this area, it means that it's the FIRST fresh new leg of an intermediate-term trend, and the price/time relationship in the higher time frames has been corrected, and we are EARLY.
It's very important that it's the first leg and fresh; stocks that already had consolidations and are trading in their 3rd and 4th legs of the intermediate trend have a lower chance of having a successful, multi-day breakout.
I've tested this big time, and first consolidations after first legs have a much higher success rate % over later stage consolidations:
-> The later into the trend, the more extended it is, the biggest risk of a stop-out.
---
Step 2:
Then the stock will get in what I call the "perfect uptrend state", which signals when:
• The 8, 20, and 50 EMAs are stacked up and trending, and
• my CML indicator is GREEN (signals a perfect blend of momentum + linearity in a stock, looking at candle overlap for linear moves)
At this point, the stock will be hitting my breadth scans, as we have those stocks in an ABSOLUTE state of momentum, and that's when they give the highest quality consolidations against the 8/20 EMAs to look for a breakout.
---
Step 3:
--> Look for the first valid volatility contraction pattern, riding the 8/20 EMAs layer.
This is the step before the breakout, and you want to see the volatility contract, with the top and bottom trendlines converging together.
This shows that in the case below, sellers are being absorbed, and buyers are about to break through the least amount of resistance, taking prices to major levels quickly.
That's the foundational principle of the volatility contraction/expansion cycle, and we want to find these stocks about to make the expansion leg in the direction of the established momentum (or uptrend).
What to look for in a high-quality consolidation here:
> at least 7 candles of consolidation before a breakout
> no close below the 20 EMA
> see VCP characteristics (mainly a higher low for longs)
> swing points should be defined to draw trendlines OR a horizontal line to trade from ( triangles and ascending triangle shapes only)
---
Step 4:
Now look for the breakout candle, breaking through resistance, and having a nice close.
Some things I want to see here are:
- strong body candle signaling buying into the close
- body of the candle should be bigger than yesterday's candle
- should be closing in upper range of the candle (marked by the 0.786% level most of the times)
- for longs, stop loss size should be <= 2.5x ADR or ATR% for the last 20 days (to keep risk-reward in check)
- Stop goes @ LOD, entering just before the close at 3:58pm EST
---
Step 5:
--> After the breakout, I ride the swing for 5 days, regardless of what happens.
I've tested exits for my momentum breakouts from consolidations with over 13k signals as a database (including my live trades since 2020), and nothing beats a 5-day hold.
I might have different trade management according to my timing model, which is not the scope of this post, but I can have for longs:
- FULL LONGS ( 🟢 light) = exit at the 5th day full position
- LONGS + PARTIALS (🟡 light) = take 40% partial at 1:1 RR, ride the rest until the close of the 5th day.
My timing model is based on lots of breadth-risk parameters, will get into that later on.
---
That's all I do, and I've been doing it for years now. You can check my track record since 2020, and I also manually gathered 10k+ signals in my Strategy Hub App (inside the community), which shows how my strategy performs since 1995.
I trade with hard rules, no discretion, and follow my daily process to scan -> identify -> enter trades in the last 20 min of the trading day.
You do NOT need to be hours in front of the charts, looking for trades, or making emotional, reactive decisions.
You need:
- a strategy
- a daily process
- base it EOD to be done in 20min/day
You can have a life outside trading while still compounding at 50%+ CAGR with low drawdown, which is the whole point of this.
If anything resonates with you, check out my pinned post in my profile with a 4hr+ masterclass on my setup, expanding everything I shared here.
Go and do the work.
You only have to do it once 📈