@DrSimEvans I take your point, but what does the yellow plot relate to? The US has 4% of the global population, yet the yellow line gives it 33% of the remaining global 1.5°C budget & 9% of the 2°C budget.Can you explain?
Using 'Equal Per Capita' the modified plot shows US 1.5/2°C pathways.
George Monbiot: “I’m not going to take lessons in climate from someone from Policy Exchange which is funded by the oil industry”
David Goodhart (Policy Exchange): “It isn’t”
GM: “I can demonstrate that it is”
DG: “Anyway, that’s not what we’re here to discuss”
#PoliticsLive
A reminder that it is our modern industrial civilization’s accelerating demand for materials that drives fossil fuel consumption, ecocide & the West’s imperialist assaults on the Global South.
In 6 recent years we've consumed nearly as much as we did in the entire 20th century.
As this op-ed by @MichaelEMann points out there is now a very real chance 'fossil fuels forever' will be humanity's epitaph! Indeed, the re-election of Trump provides a possible answer to the Fermi Paradox! "Welcome to the American petrostate" https://t.co/WEyzEccF4I
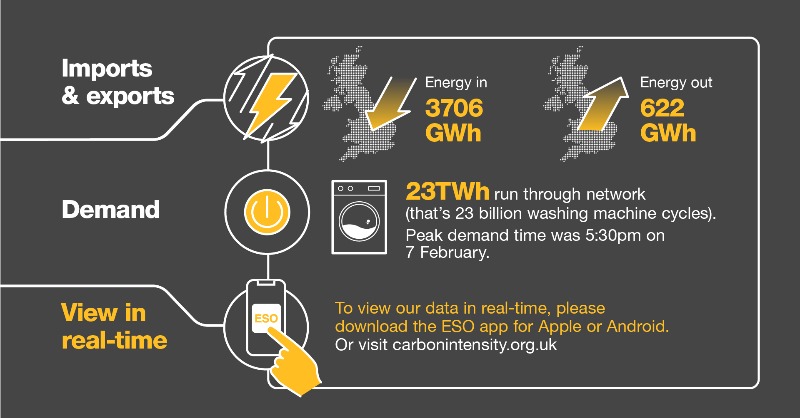
New low carbon record 🏆🍃 On 5 April at around midday, we achieved a new low carbon intensity record of 21gCO2/kWh, beating the previous record set on 18 September 2023 of 27gCO2/kWh. 💚🌍
📱 Download our carbon intensity app to see real time generation stats and our records 👉https://t.co/CSPwQs79Sf
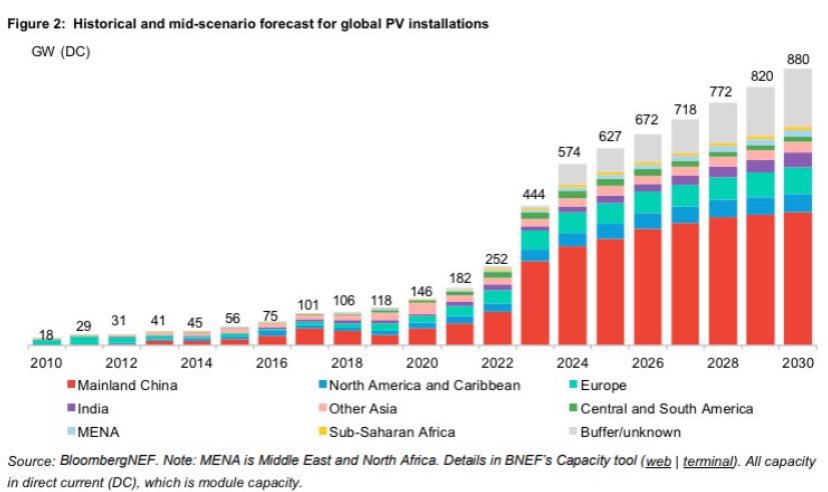
“Put another way, the extra 4GtCO2e from a second Trump term would negate – twice over – all of the savings from deploying wind, solar and other clean technologies around the world over the past five years.” https://t.co/KaxxVWQ4c8
In February, wind provided more than a third of our electricity. 🌬 Over half of electricity came from zero-carbon sources 🍃, peaking at 84% on 4 February at 12:30pm, helping us achieve the lowest average carbon intensity month in the last year. 🌍 See February's full stats. �In February, wind provided more than a third of our electricity. 🌬 Over half of electricity came from zero-carbon sources 🍃, peaking at 84% on 4 February at 12:30pm, helping us achieve the lowest average carbon intensity month in the last year. 🌍 See February's full stats. �In February, wind provided more than a third of our electricity. 🌬 Over half of electricity came from zero-carbon sources 🍃, peaking at 84% on 4 February at 12:30pm, helping us achieve the lowest average carbon intensity month in the last year. 🌍 See February's full stats. �In February, wind provided more than a third of our electricity. 🌬 Over half of electricity came from zero-carbon sources 🍃, peaking at 84% on 4 February at 12:30pm, helping us achieve the lowest average carbon intensity month in the last year. 🌍 See February's full stats. 👇
The insect apocalypse is here
Flying insect numbers have plunged by 60% in less than 20 years and declining by 1% to 2% a year
Without insects there will be no birds, reptiles, and amphibians—and due to their pollinating services mass famine for humans https://t.co/TpIdTM8tGg
It's become a bit of a cliche to call it a paradox or a contradiction that China is building staggering amounts of both new clean power generation and new coal power plants.
It only is one if you fail to grasp the scale of China's electricity consumption growth, as most people inevitably do.
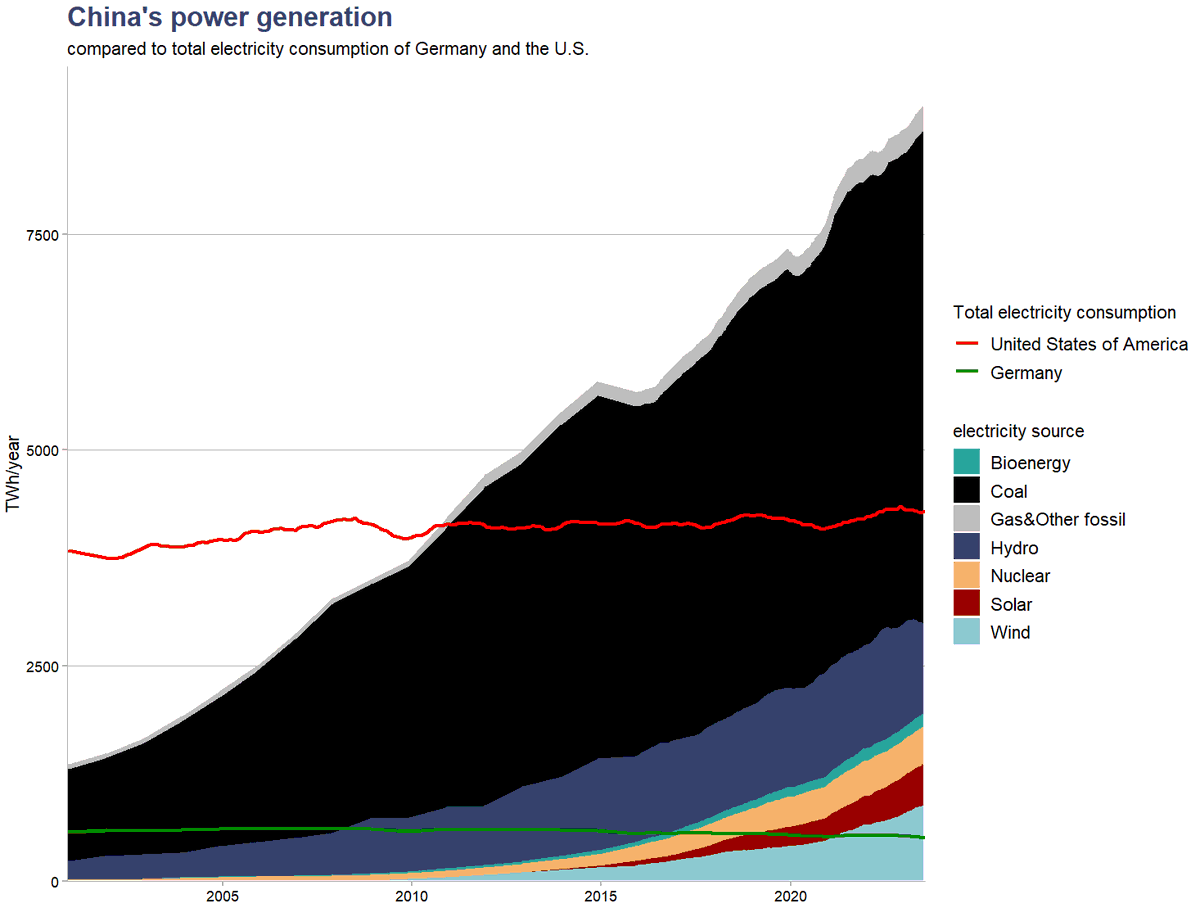
China today generates enough power from clean sources to power Germany SIX times over, up from two times a decade ago. In a few years, China's clean power generation will be equal to U.S.' total electricity consumption. China's power generation from wind&solar alone is about to hit three times Germany's total electricity consumption next year.
If China's power demand had stayed on 2009 level, the massive increase in CO2-free power generation would have made the grid 80% clean, instead of the current 33%. CO2 emissions from the power sector would have fallen by 75%.
What happened instead is that electricity demand doubled and clean power generation didn't keep up, while it did manage to increase its share from 20% to 33%. Predictably, the difference was delivered from coal, and CO2 emissions went up by 90%.
China now uses twice as much power as the U.S., after overtaking the country only in 2010. Put another way, China's additional power demand since 2010 is equal to the total consumption of the U.S.
60% of that electricity demand growth went to industry, mainly basic manufacturing like steel and other metals, cement, glass and chemicals, so it's really a function of China's extremely investment- and construction intensive growth model.
And no, it's not just about the size of China's population: per capita electricity consumption in China overtook Germany in 2022.
The good news is that China's clean energy growth is finally reaching the scale where it can cover all of the growth in power demand. This is happening even as power demand growth likely slows down with the economic slowdown.
These trends have been masked in the past year by the collapse in hydropower generation which is readily visible in the graph, but will likely become apparent in the year or two.
Most of the data for the post and the graph is from the amazing datasets of @EmberClimate.
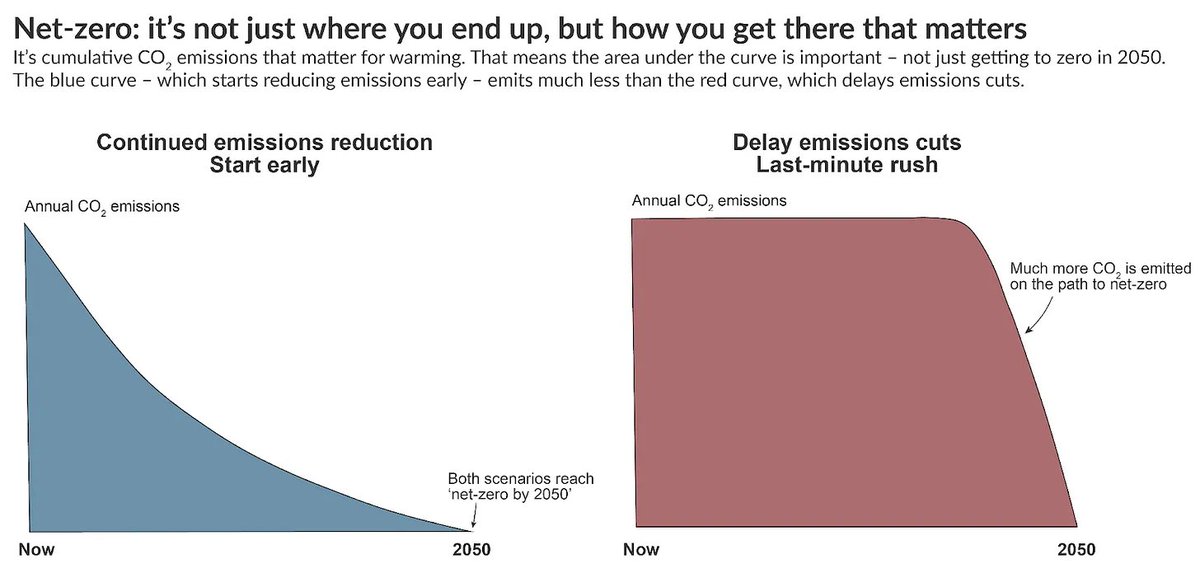
Net-zero targets are all well and good.
But how countries get there matters a lot. It's the area under the curve that matters for warming.
Delay emissions cuts and you not only make net-zero less likely, you also make climate change worse along the way.
Not sure if you noticed, but as of yesterday, the UK only had one coal-fired power station remaining
UK coal use is now the lowest it's been since 1757
https://t.co/N9odr1x3wG
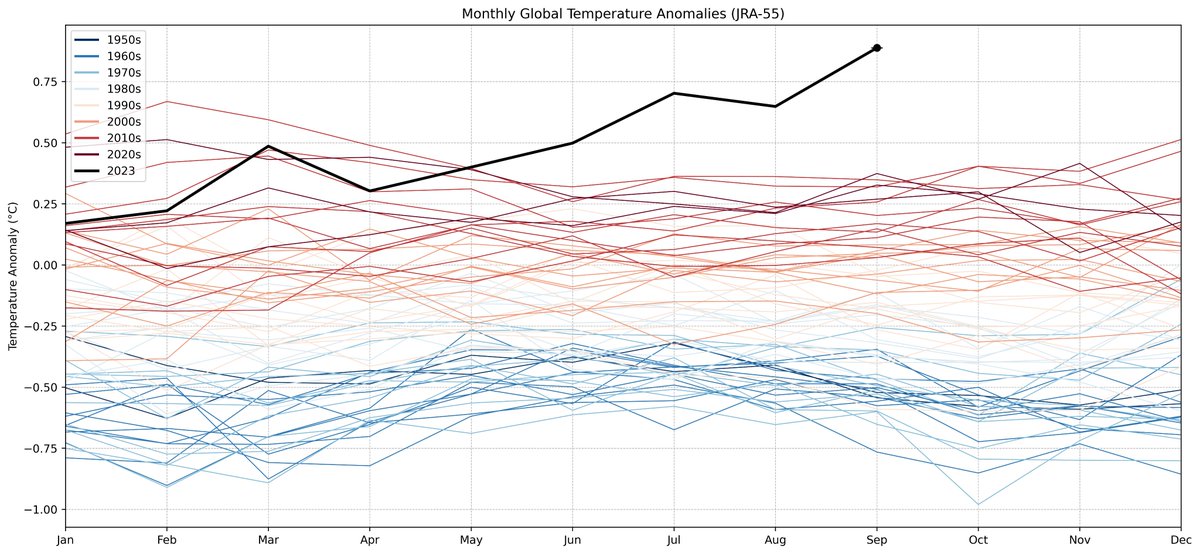
September was at +1.8C vs pre-industrial levels... who still believes in the 1.5C target? who still believes in the 2.0C target? I'm not interested in whether "technically" we can make it, I'm interested in whether "realistically". And yet every decimal of degree counts.
The first global temperature data is in for the full month of September. This month was, in my professional opinion as a climate scientist – absolutely gobsmackingly bananas. JRA-55 beat the prior monthly record by over 0.5C, and was around 1.8C warmer than preindutrial levels.
Today, we need to eat approximately 2x more meat, 3x more fruit, and 4-5x more vegetables to get the same amount of mineral nutrition as offered by the same foods prior to the industrialization of our food system.