We've added to the website a free PDF of the Bayesian Workflow book (for non-commercial purposes, like research and exorcism). We put so much work into this book, hope you all find value in it. https://t.co/f472XjM6cf
If you do not yet have a "companion coding/research agent" running locally as a dev, this guide is absolute gold from @mitchellh (creator of Terraform).
It's practical, step by step & how he changed how he works (without getting overloaded or anxious.)
https://t.co/pnLZ1eQFpi
The 1.4 release of @duckdb supports using a DuckDB database to serve vector tiles!
Of course, I had to try this out in R.
Check it out: all 242,000 US Census block groups dynamically served as vector tiles from a DuckDB database, displayed on a MapLibre map from R in Positron.
For years, I've wanted to create an #rstats package bringing the power of Mapbox to R users.
After a few failed attempts, I finally got {mapgl} over the finish line in 2024 (with some help from #GenAI).
Get started with an interactive globe in one line of R code, and build from there!
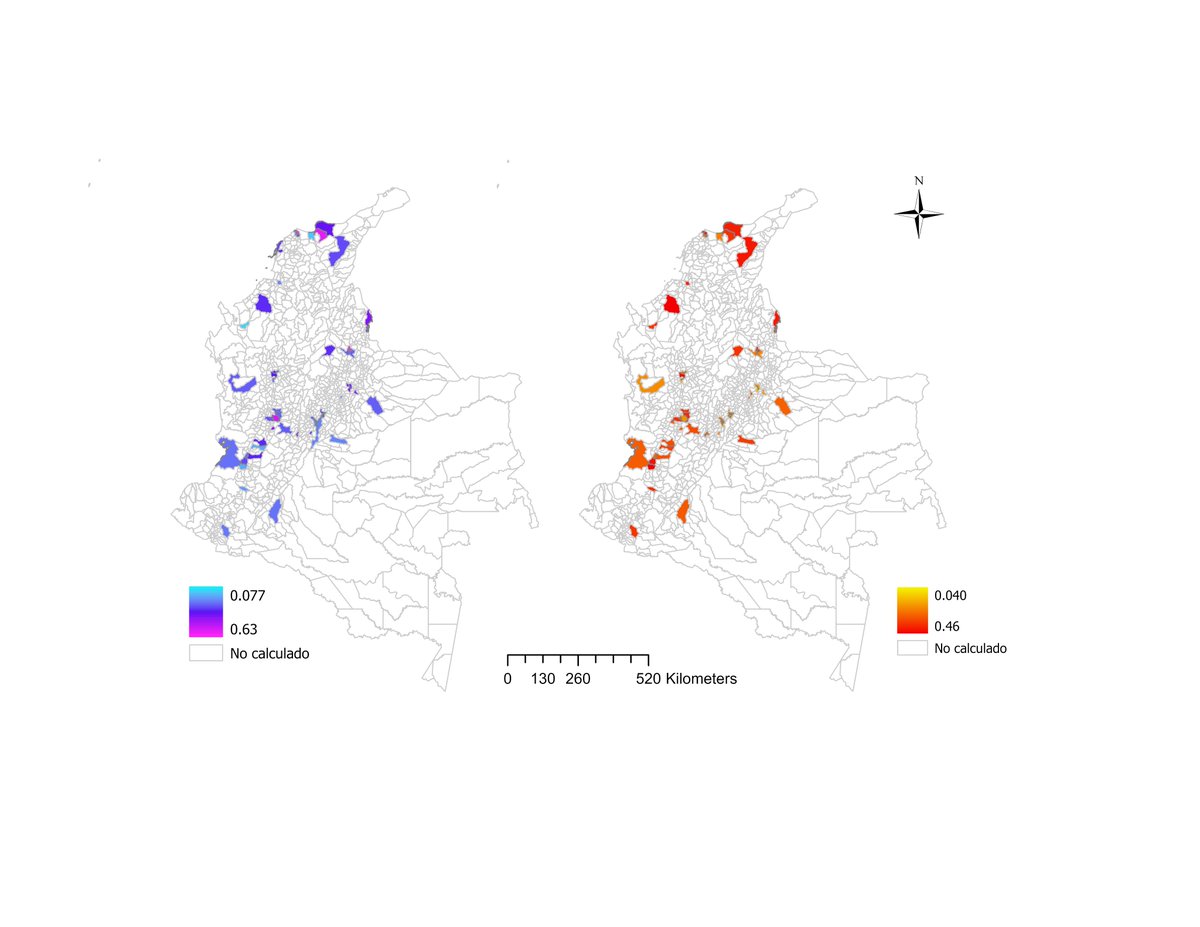
La ciudades de Colombia presentan gran segregación con respecto a la raza y el nivel educativo. Ciudades mas fragmentadas tienen lamayor segregación
Estudio de SALURBAL @LACUrbanHealth@MajoAlRiv
https://t.co/AN74ysKSlv
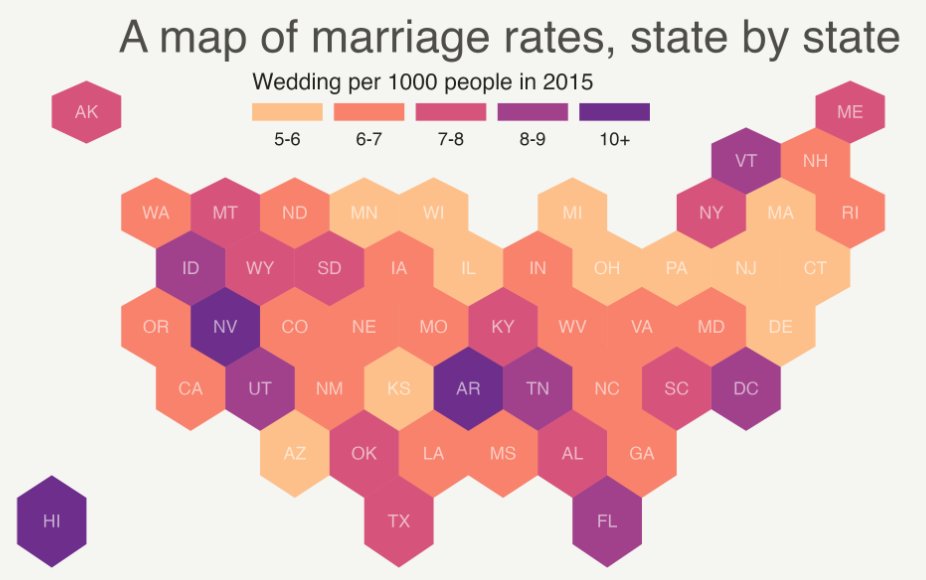
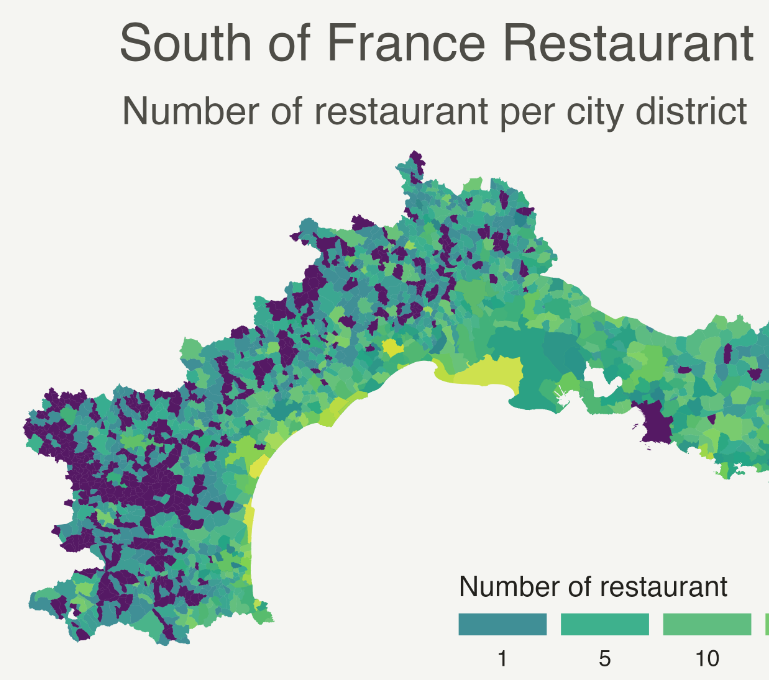
🌎 The R Graph Gallery now has about 50 map tutorials.
Choropleth, Hexbin, Bubble, Cartogram, Connections...
Most of the tutorials have JUST been updated to use {sf} thanks to @dhernangomez 🙏🙏🙏
Did you make a stunning map recently? I'm looking for polished examples!
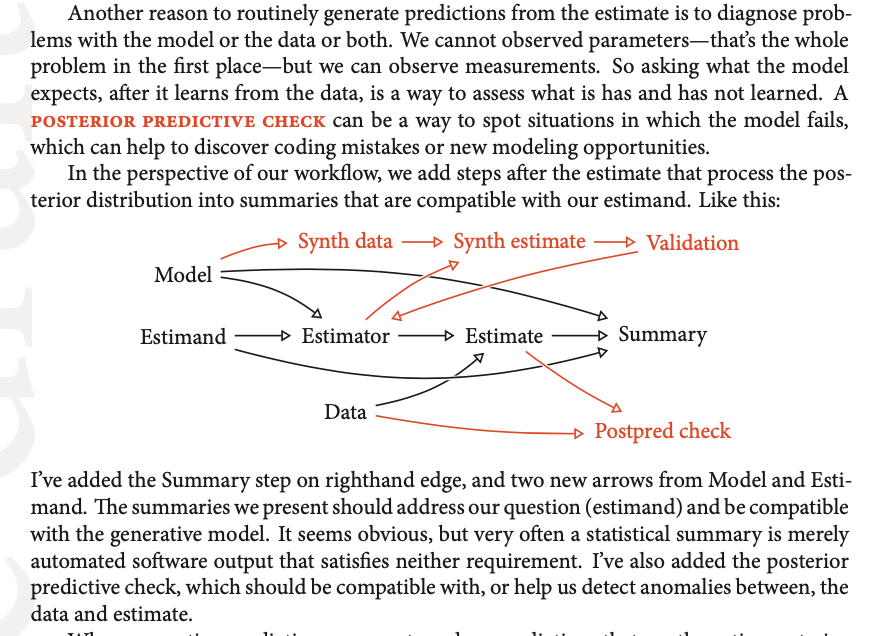
The work must flow - Just revising my book yet again to incorporate some workflow ideas from previous months. I could improve this diagram I know. I just need another 100 hours to figure out all the necessary tikz commands
Causal salad, causal design, causal inference. I did a 3 hour workshop in Leipzig yesterday on causal inference, aka why your regressions are garbage lolsob. Here's a recording of me covering the same content, I promise it's not boring: https://t.co/VGd9YyPsSe
Muchisimas gracias @Rdaycolombia por la invitacion y las preguntas tan interesantes! 🇨🇴👩💻📊
Mi presentacion con recursos y ejemplos de #rstats para analisis de datos espaciales y la vigilancia en salud:
🔗 https://t.co/1Xs0BPQUSC
#rspatial#GISchat#epitwitter
“The more senior you are, the more you'll be expected to organize and publish at the next level.”
Absolutely loved the Produce/Organize/Publish framework by @shreyas that @GergelyOrosz mentions on his recently launched book.
Produce -> Organize -> Publish (or Self-Promote)
Hi #EconTwitter! 📊
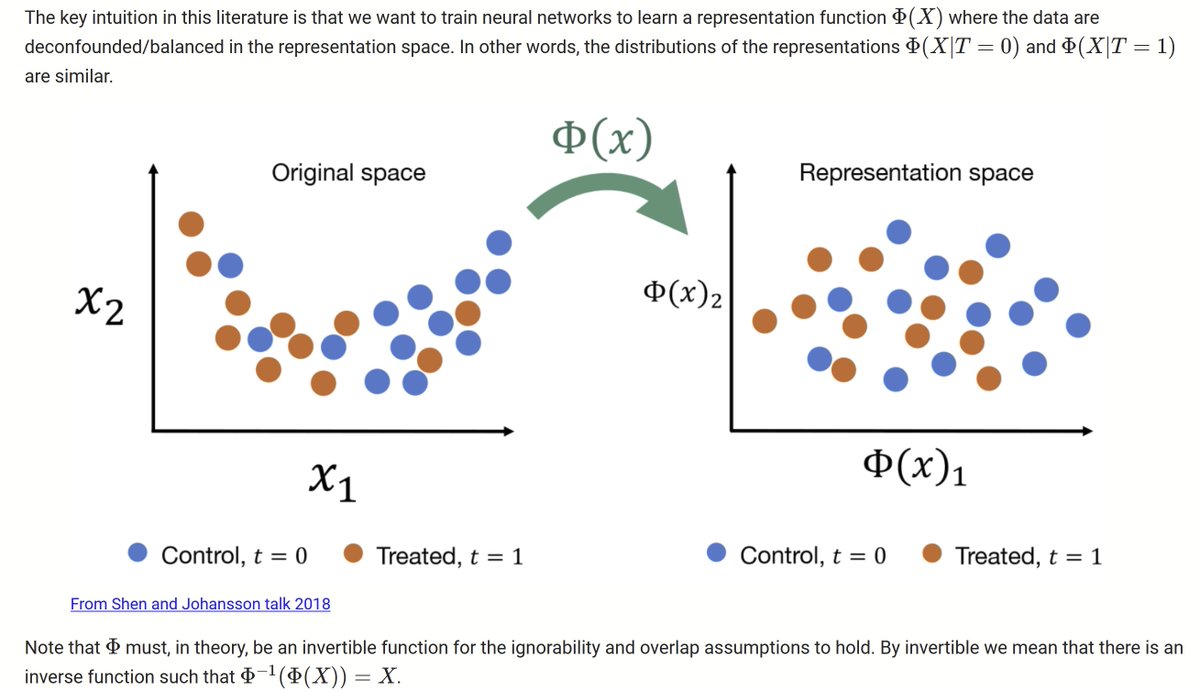
Interested in the intersection between causal inference, econometrics and machine learning?
Check out 👇 this fascinating 90' tutorial by Bernard Koch (@UCLA) on deep learning for causal inference.
Perfect for those exploring how neural networks can enhance #econometrics in high-dimensional, non-linear settings. 💻
Jump in to see how #MachineLearning reshapes your econometric background!
Link: https://t.co/xSQ0wxHGv7
lecture notes: https://t.co/4tewQZPl5V
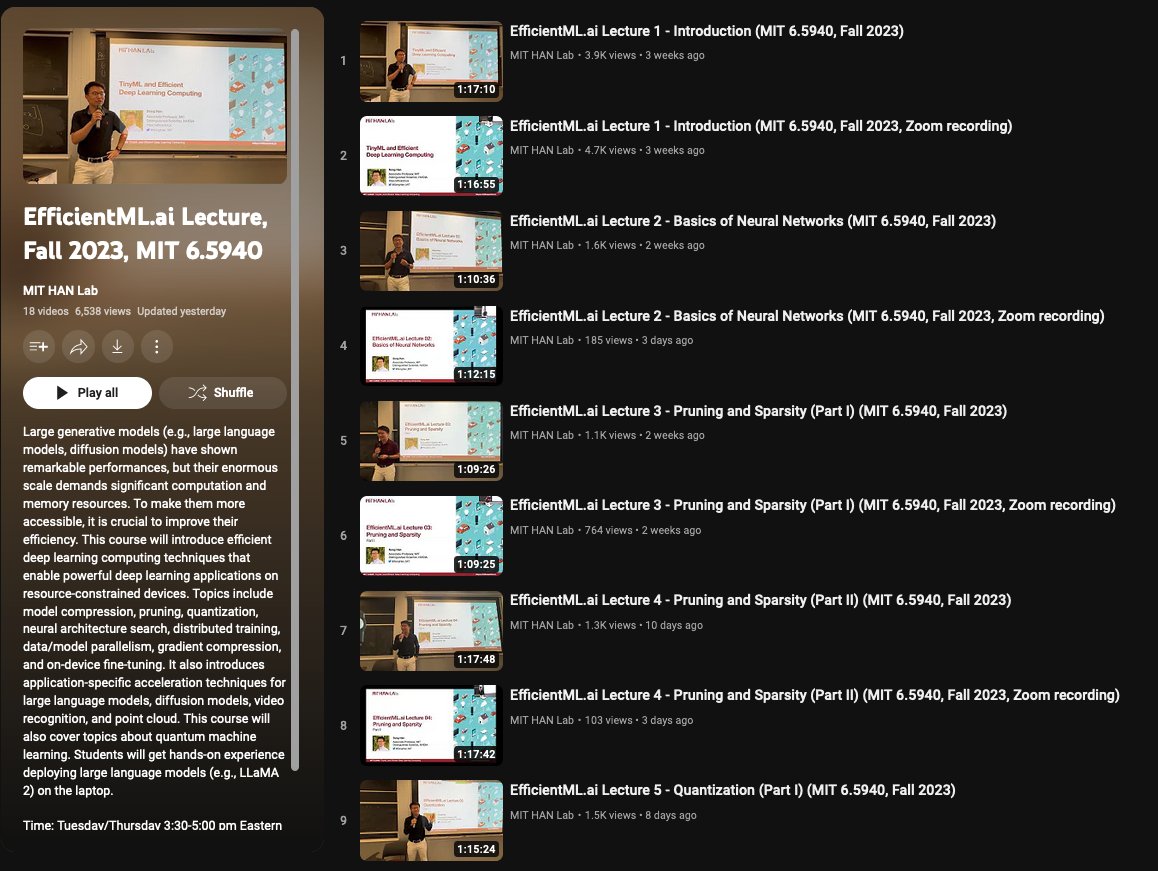
TinyML and Efficient Deep Learning Computing, MIT 2023
A course that covers efficient AI techniques used for deploying deep learning models on resource-constrained devices.
The topics covered include model compression, pruning, quantization, neural architecture search, distributed training, data/model parallelism, gradient compression, on-device fine-tuning, and applications specific techniques for large language models, diffusion models, and video recognition.
Large language(and image) models are remarkably great at tasks they do but getting them to actually work require a huge amount of computational resources. It's nice to see courses that are dedicated for demystifying large models deployments.
Lecture videos: https://t.co/tkz2KzBboI
Website: https://t.co/28GUaq9LN1
📈Curso online gratuito: Diseño gráfico con ggplot2
Cómo crear visualizaciones atractivas y complejas en #RStats
- totalmente reproducible
- sin necesidad de ajustar manualmente los detalles después
- accesibilidad, impacto y complejidad
by @CedScherer
https://t.co/uRK3I8D2TV









![Rainmaker1973's tweet photo. How a book written in 1910 could teach you calculus better than several books of today
[Full text: https://t.co/55dkZAfec3] https://t.co/1kgmnklGjK](https://pbs.twimg.com/media/F9NqCTUakAEb7sg.jpg)