@SmartReversals Quick question. How could the SPX close higher 79% of the time over a 20-year lookback period. 16/20 would be 80%. 15/20 would be 75%.
15/19 would be rounded to 79%. Was there an UNCH July that you eliminated from the calculation?
@jaykaeppel@sentimentrader I respectfully beg to differ.
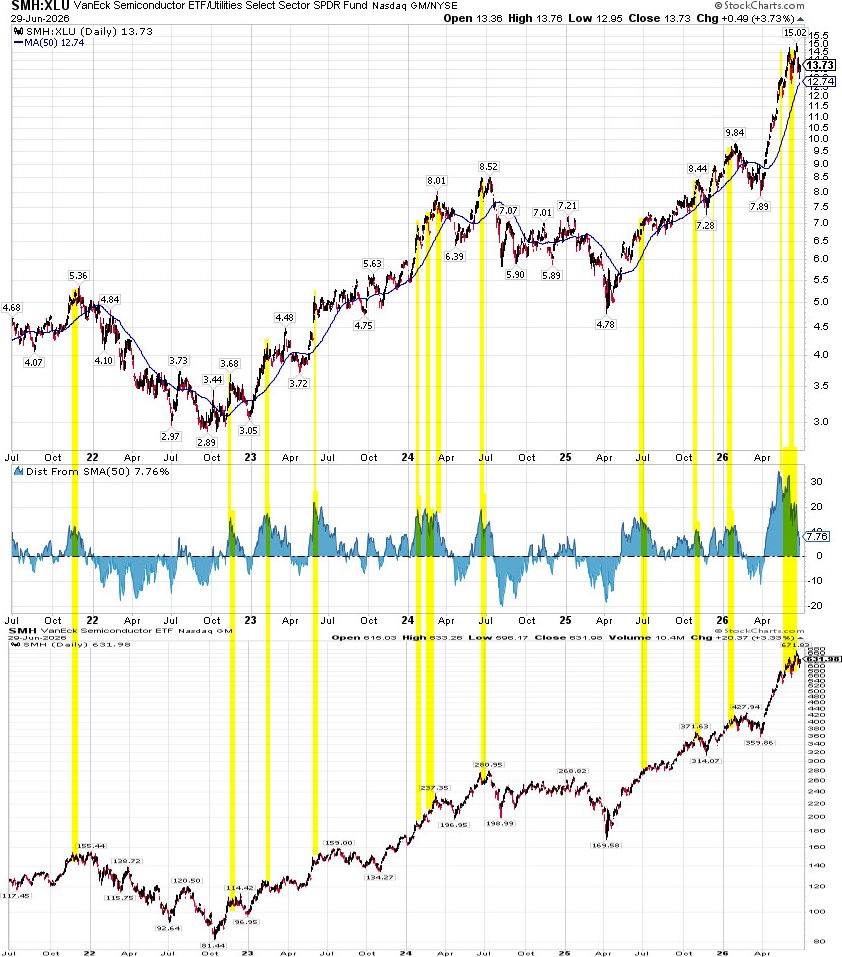
Pane 1: SMH/XLU
Pane 2: % over its 50-dma of SMH/XLU.
Pane 3: SMH price .
Yellow highlights = pretty high or fairly high peaks in pane 2.
Pane 2 peaks tend to lead to choppy or down months of action for SMH.
@greg_ip Because fascism and socialism have state control in common.. but if u can't tell the difference in other ways, then don't blame Bernie for your moral boindness.
@Chartfest1 Last time Knicks won championship, March '73, the spx peaked around 114, then fell about 50% by Aug '74.
Small sample size: 1
But not encouraging.
@Chartfest1 In the 30 years I've been paying close attention, it seems to me that this kind of rotation usually goes on until the rotation "shockingly" morphs into highly correlated selling. ("Why are they selling gold AND risk assets!?--that's when the selling is done.)
@DeItaone Spend tens of Billions direct cost, +tens of B more in damage to US bases, + loss of civilian and US military lives, wreck the oil market & global economy, give Iran 10s of B...all so we can try to get back to the terms of the JCPOA, which Trump withdrew from in '18. Shmuck!
@nullcharts 1974 was the nadir of a secular bear market (1966-1982).
We are either 13 or 17 years into this bull market (launched either 2009 or 2013, depending on whether you want to consider it launched at the nadir of the bear or at the breakout to a new all-time high).
Disanalogy.
@RonDeSantis Good God, you're a moron. Did you really go to Harvard? You're a complete sack of shit for disingenously asking this question to which you MUST know the answer. Either that, or you're WAY dumber than I thought you were! (And I already thought you were pretty fucking stupid!)
@HostileCharts Secular bear va secular bull. 17-yr cycles. Secular bulls '46-'66 and '82-'00. Bears '66-'82 and 00-13 (shortened by fed's ZIRP).
Current bull '13-'30.
Two different types of normal.
@TimmerFidelity Hearkening to our brief conversation about secular bulls, some time ago, we're now 17 years post-2009-low. But only 13 years post-2013-SPX breakout thru 1576.
CAPE peaks tend to come at the terminus of secular bulls. 1966, 2000....and it sure looks like it will be 2030 (not 2026)
@DougKass You keep asking that question...but I I'm beginning to suspect from the links in your posts that you know the answer! There's a common theme...a pattern I'm beginning to cognize.
@mark_ungewitter Personally, I would go with, "how has the market behaved when this indicator has peaked at a level equal to the current one or higher?" As per the blue highlights below. And the answer is that the probability of a period of retrenchment is increased.