Discovery of a new biomarker (RNAPII) in cancer that denotes aggressiveness, increased risk of recurrence, shown in breast cancer and meningioma (<-Figure)
@ScienceMagazine
https://t.co/i7Xp8gZJba
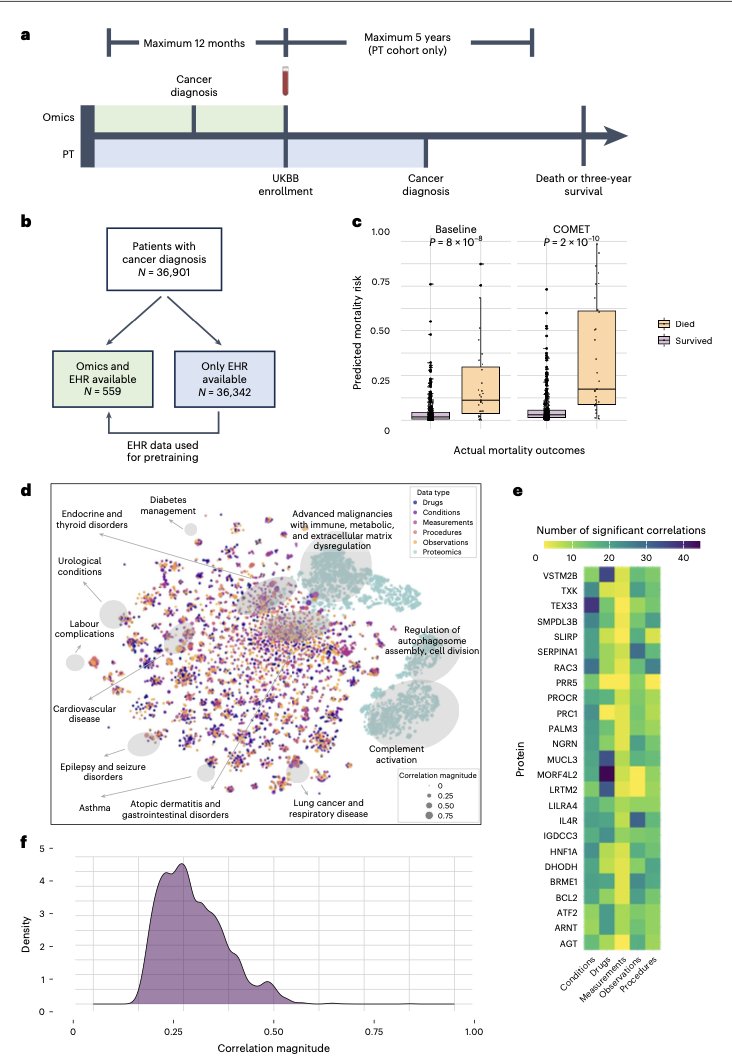
Using multimodal A.I. to more accurately predict a person's risk of cancer (and other conditions) by combining proteomics and electronic health records https://t.co/wZtarbQbt5 @NimaAghaeepour@NatMachIntell open-access
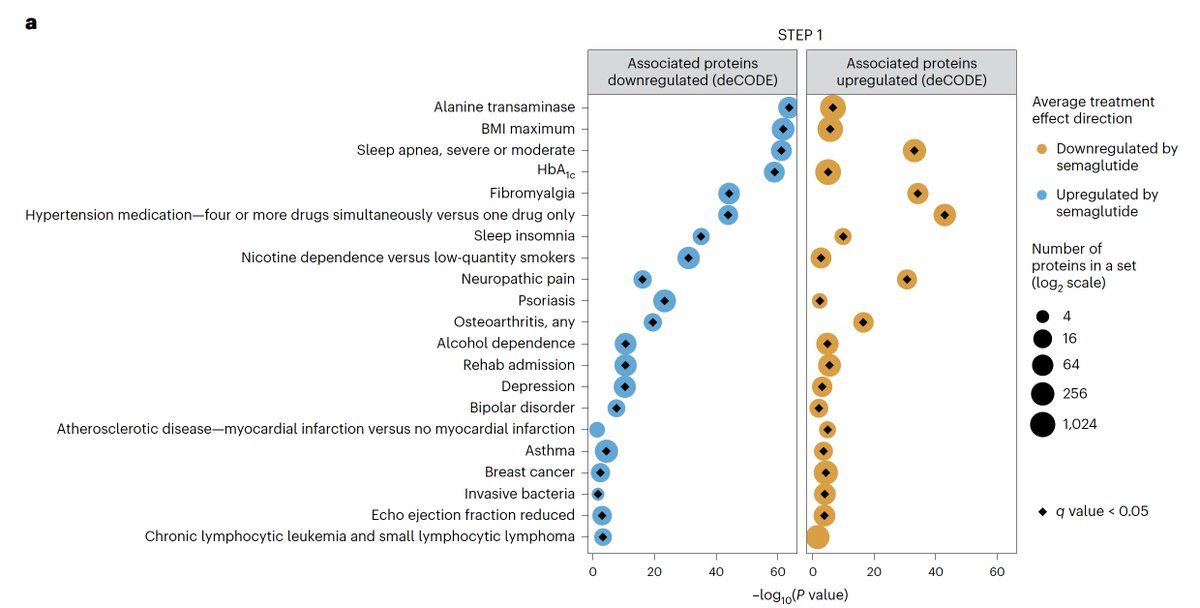
The effects of GLP-1 drug (semaglutide) on the proteome shows broad impact, potential relevance to many diseases beyond obesity
https://t.co/0IR3N8WY6P @NatureMedicine
The problem with "open #AI systems" is that they're not open.
@Nature
https://t.co/SFzOMasz7N
"We reveal a map of open AI which shows that....
[it] is highly dependent on the resources of a few large corporate actors, who effectively control the AI industry and the research ecology beyond."
For readers interested in bispecific antibodies as cancer therapies, here's a comprehensive recent review
https://t.co/ybCSH28xRg
https://t.co/2BI5xgxHGg
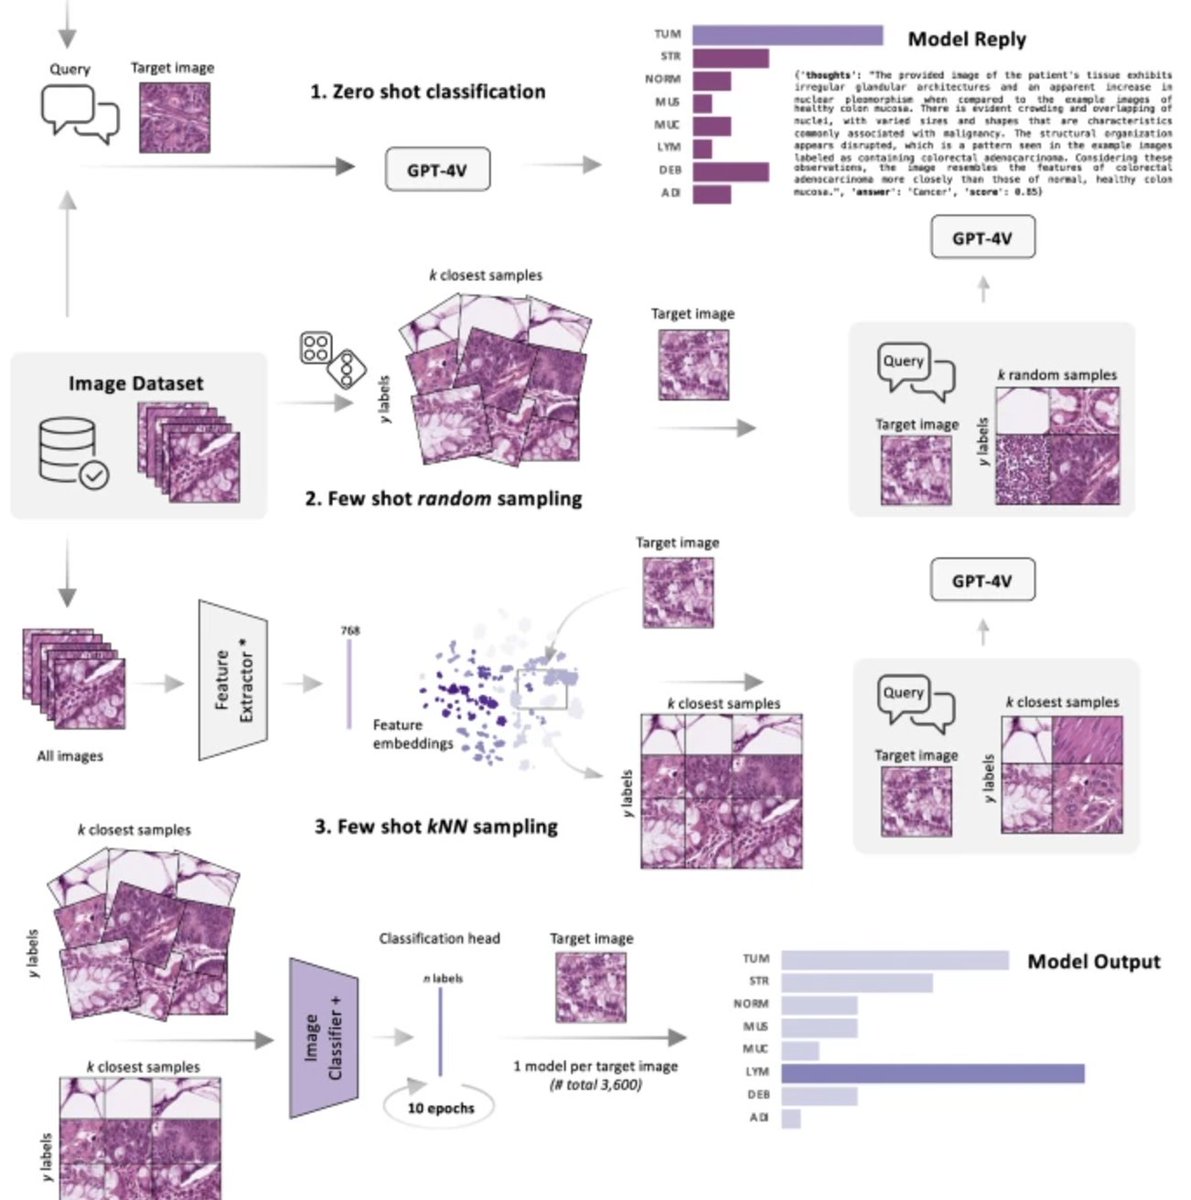
Happy to share our new paper from @katherlab , led by @Dykex6 , which was just published in @NatureComms. In-context learning enables general-purpose vision language models to perform well on medical image analysis tasks. We don't need to train a neural network at all - just provide a handful of examples at inference time.
https://t.co/Lz6VwRoNmZ
PS: follow me on https://t.co/TS8XGbyf39
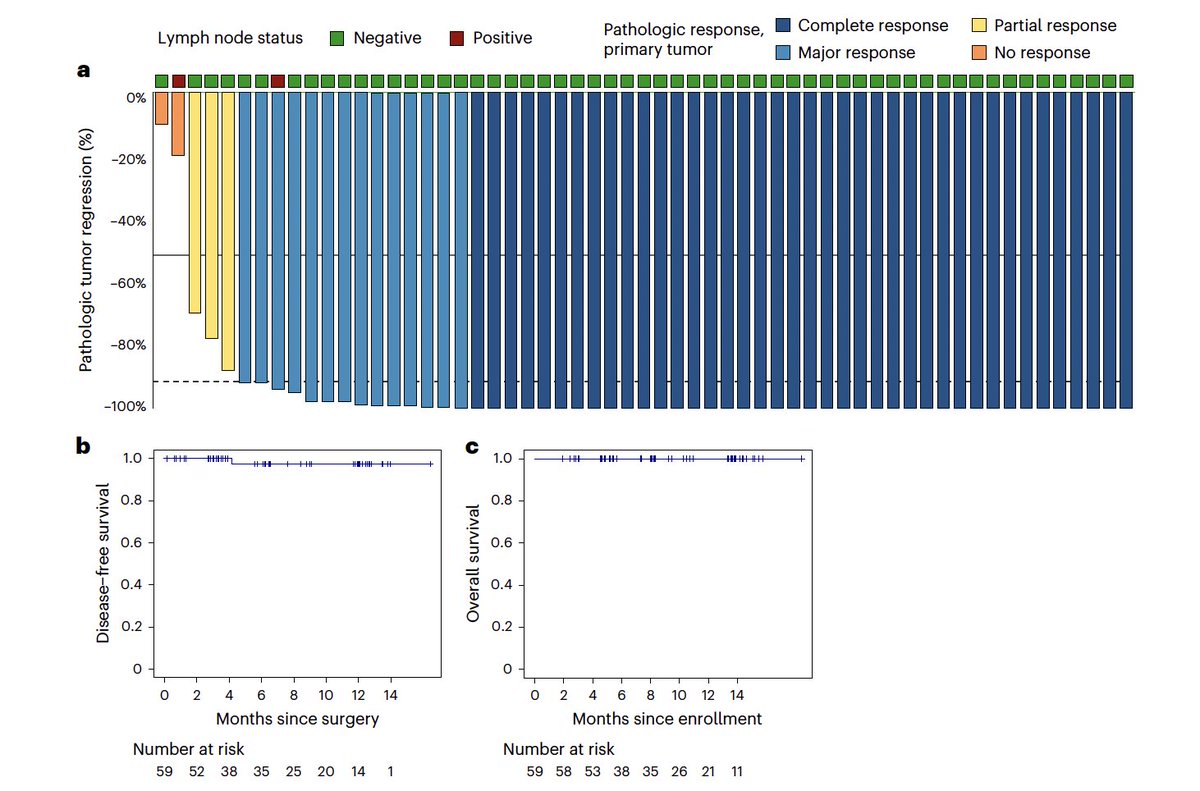
Neoadjuvant nivolumab & relatlimab in locally advanced MSI CRC
@NatureMedicine
https://t.co/A60sHnYIcr
🔎NICHE-3 phs 2
👉PR 97%, MPR 92%, pCR 68%
👉only one recurrence
👉Gr 3–4 irAEs 10%
💪Impressive, we need to find the most effective, least toxic combination
@myESMO
ctDNA-based MRD & survival in resectable CRC
@NatureMedicine
https://t.co/Td1vdPs0ql
🔎CIRCULATE-🇯🇵 GALAXY, 2,240 pts
👉shorter DFS in MRD+ patients
👉Better outcome after sustained ctDNA clearance in response to ACT
🧐What else do we need to implement into clinical practice?
@myESMO
Adjuvant immunotherapy in pts with resected GC/GEJ cancer following pre-OP CTx with high risk for recurrence (ypN+m R1)
https://t.co/UAGD7nfd1o
🔎EORTC 1707 VESTIGE, 195 pts
👉DFS 11.4 vs 20.8 mo
🧐Nivolumab/ipilimumab does not improve DFS, CTx remains best option
@myESMO
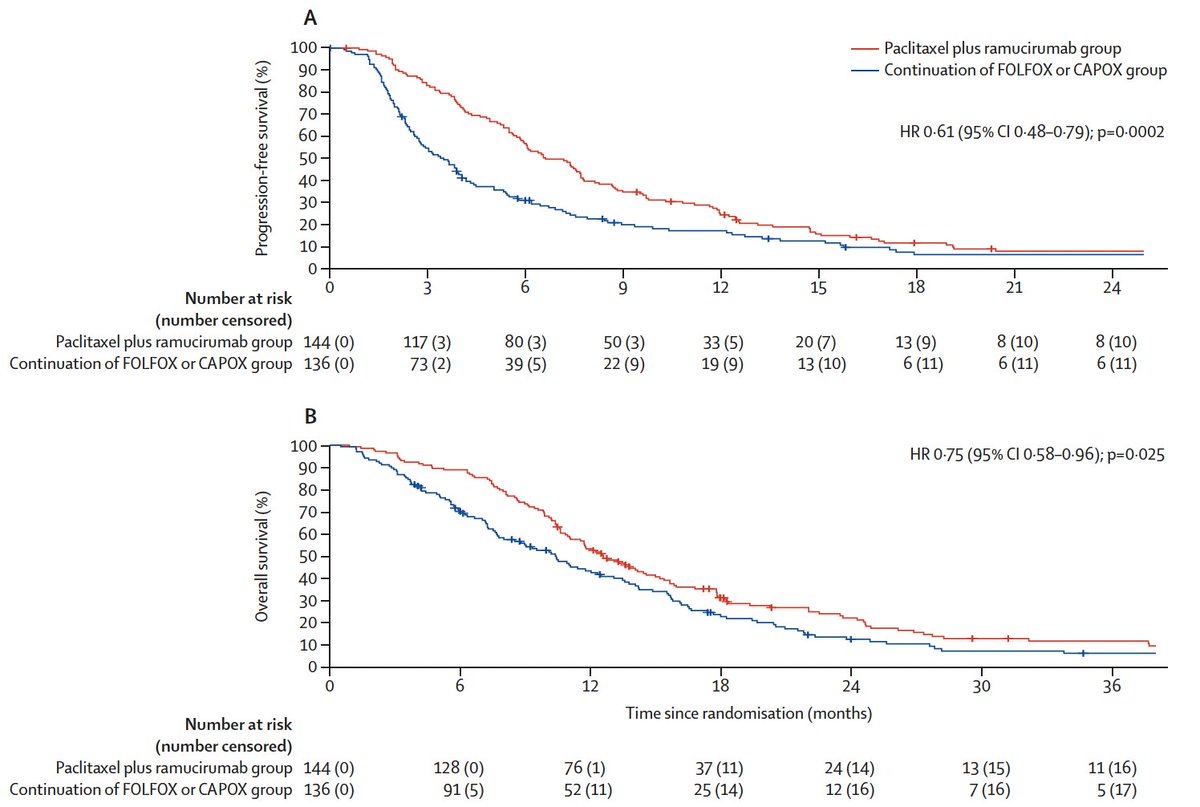
Ramucirumab/paclitaxel as switch maintenance vs continuation of FOLFOX HER2-negative GC/GEJ cancer
@TheLancetOncol
https://t.co/YwadIgg0rD
🔎ARMANI phs 3
👉mPFS 6·6 vs 3·5 mo
👉mOS 12·6 vs 10·4 mo
🧐switch maintenance could be an option for pts who are not eligible for ICI/🎯💊
@myESMO
Concordance of ctDNA and tissue genomic profiling in biliary tract cancer
@JHepatology
https://t.co/i53bksEIxs
👉concordance in 84.8%,
👉ctDNA revealed 🎯GA in 34.3%
👉high VAF in ctDNA associated w/ poor prognosis
🧐LB valuable option
@myESMO@EASLedu@ILCAnews@curecc #livertwitter
A highly innovative, potential breakthrough in synthetic biology: engineered receptor platform to activate specific cells based on their cell surface molecules, such as immune response to cancer
https://t.co/gchrwElvfN @Nature@UCSF@KoleRoybal@roybal_lab@parkerici@piraner
Add custom text styling to your ggplot2 visualizations with ggtext, an extension that brings advanced text formatting options directly into your R plots. With ggtext, you can use Markdown and HTML to style plot text, allowing you to incorporate features like bold, italics, colors, and more complex layouts.
Key benefits of using ggtext include:
✔️ Enhanced Aesthetic Control: Style individual plot titles, labels, and annotations with Markdown or HTML, providing precise control over text appearance.
✔️ Custom Formatting: Easily mix and match text styles within the same plot element, such as adding bold or colored text to specific words in titles.
✔️ Dynamic Styling Options: Customize plots to align more closely with branding or design standards, improving clarity and visual appeal.
Using ggtext in ggplot2 is straightforward. By replacing standard text elements with element_markdown() in the plot’s theme, you can apply rich formatting to elements like plot.title, axis.title, and legend.text. This flexibility enables you to bring text to life in your plots without needing external design tools.
The example visualization shown here is from the ggtext package website and demonstrates these formatting features: https://t.co/eZY9Im5h1z
To learn more about creating visually compelling plots with R, check out my course, "Data Visualization in R Using ggplot2 & Friends," starting November 25, 2024!
Learn more: https://t.co/ztlEzoEDWv
#ggplot2 #Statistical #datavis #RStats #Rpackage #datasciencetraining
The relationship of physical activity and life expectancy
https://t.co/6pdJTOWGPi
Summary points from the paper:
—Americans over the age of 40 could live an
extra 5.3 years if all were as active as the top
25% of the population.
— For the least active 25% of Americans, an extra
hour’s walk could add 6.3 hours of additional
life expectancy.