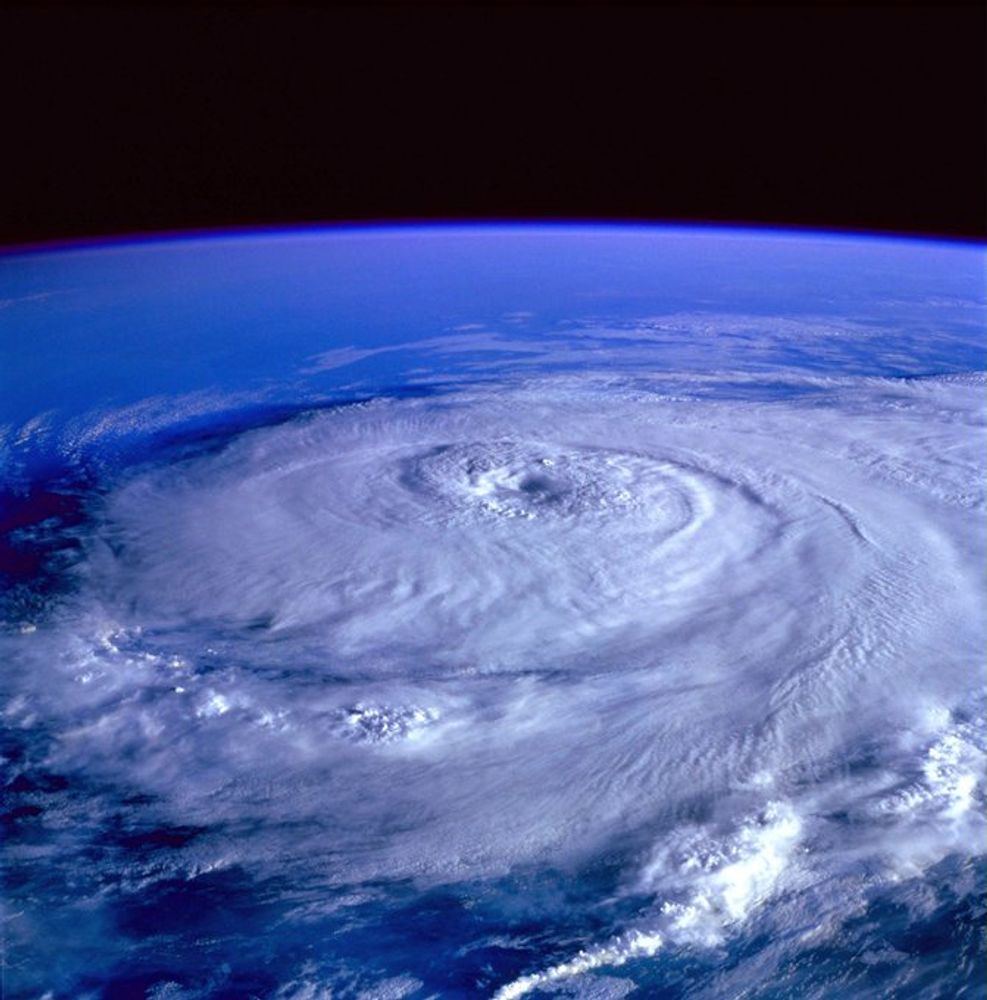
Large scale-power outages caused by tropical #cyclones can be prevented almost entirely if a small but critical set of power lines is protected against storm damages, a new PIK-study with @KatjaFrieler published in @Nature Energy finds: https://t.co/9W816dZbqE
Wer zahlt für die Klimakatastrophe? Bei #COP28 wird u.a. verhandelt, inwiefern Industrieländer ärmere Staaten für Klimafolgen entschädigen sollten. Anhand wissenschaftlicher Berechnungen zeigen wir, welche enormen Summen dafür umverteilt werden müssten.
https://t.co/OBmGx7AQu6
New working paper! Methodology to identify people exposed to, vulnerable to, or at high risk from climate shocks. Goal is to better track progress in building people's resilience, despite the (huge) methodological and data challenges.
Work in progress!
https://t.co/e0owXRv7w6
Most countries don't have official sub-national GDP data.
However, some geospatial datasets provide these insights for every country in the world.
Here's a comprehensive list of geospatial GDP datasets, I wish I knew about 5 years ago:
Tropical cyclones substantially raise the social cost of carbon: With #GlobalWarming the share of the most intense tropical #cyclones is expected to increase so that economies may not be able to recover fully in between storms, a new study shows. https://t.co/ILwTr3I8VT
Schwere tropische #Wirbelstürme können die wirtschaftliche Entwicklung eines Landes für mehr als ein Jahrzehnt ausbremsen. Berücksichtigt man diese Langzeitfolgen, erhöhen sich die gesellschaftlichen Kosten von CO2-Emissionen weltweit um mehr als 20%: https://t.co/ytFxeaFjLu
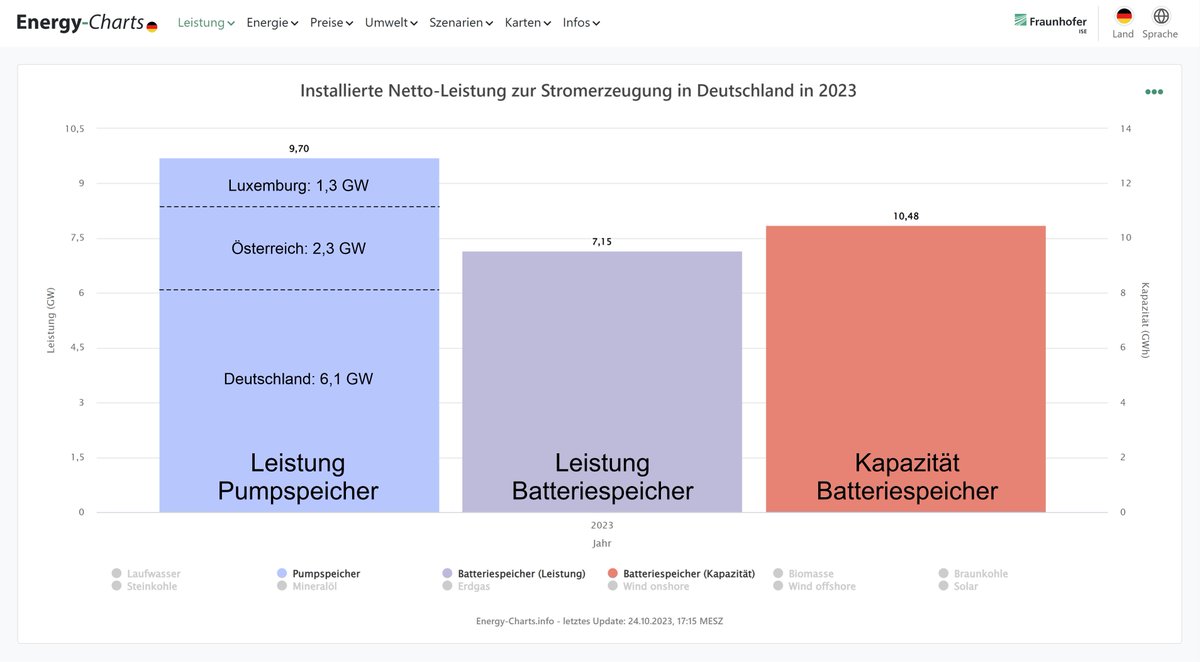
Die in Deutschland installierten Batteriespeicher haben eine Leistung von 7,15 GW und eine Kapazität von 10,5 GWh.
Die in Deutschland installierten Pumpspeicher haben eine Leistung von 6,1 GW. Hinzu kommen 2,3 GW aus Österreich und 1,3 GW aus Luxemburg.
https://t.co/6y5sKj4qvw
Curious about how trade can improve #FoodSecurity?
Our paper discusses how trade integration can be used as a tool to stabilise #FoodPrices and mitigate the impact of extreme weather events on agricultural markets ⤵️
https://t.co/4LRUeYvVtV
Reducing food loss and waste is critical to reducing environmental impacts of food systems. But if left to markets, efficiency improvements will have rebound effects that could wipe out 53–71% of the gains. New research in Nature: https://t.co/DEGXWt8bp0
Three members of my team published an empirical study in Nature Sustainability on scientists' views re compatibility of economic growth & sustainability. Findings stress need for alternative post-growth perspectives, with agrowth counting on most support. https://t.co/EaHkACUhBv
The only ChatGPT guide you'll ever need.
Go from beginner to pro with the ultimate ChatGPT Cheat Sheet.
Get more tools & guides like this by signing up to Superhuman AI--the world’s biggest AI newsletter.
Neu auf https://t.co/uhrDFmkSUR: Unser Emissions-Explorer zeigt erstmals detailliert, woher Österreichs Emissionen kommen. PKWs und die Metallindustrie sind für jeweils 15% der Gesamtemissionen verantwortlich, schwere Nutzfahrzeuge für 10% und die Verdauung von Nutztieren für 5%!
I wrote a blog post to summarise the key ideas and moments of the #BeyondGrowth Conference, hosted earlier this week at the European Parliament. #BeyondGrowth2023 https://t.co/53gZBqUuHm
For those using
@jmwooldridge
's "Introductory #Econometrics" book, you probably know about Florian Heiss & Daniel Brunner books for Learning #R and #Python
Great news now there is one more using #julia!
Great way to learn all the basics!
For now he also has the pdfs!
Starting today you can download Multidimensional Economic Complexity data for free at the OEC.
Explore how countries compare in trade, tech, and research complexity, or download the data for your own research purposes.
https://t.co/lTIVP2lcDE
@AarneGranlund @KevinClimate@IEA In a growth-based economy growing at 3% annually, global resource use doubles every 24 years. Efficiency is needed but is only effective in an economy without a growth imperitive.
In the 20th century, the U.S. built world-class weather forecasting, collecting data and building public systems that improved crop yields, transport, storm preparedness, and defense strategy. 1/
https://t.co/He6JxxvGzS
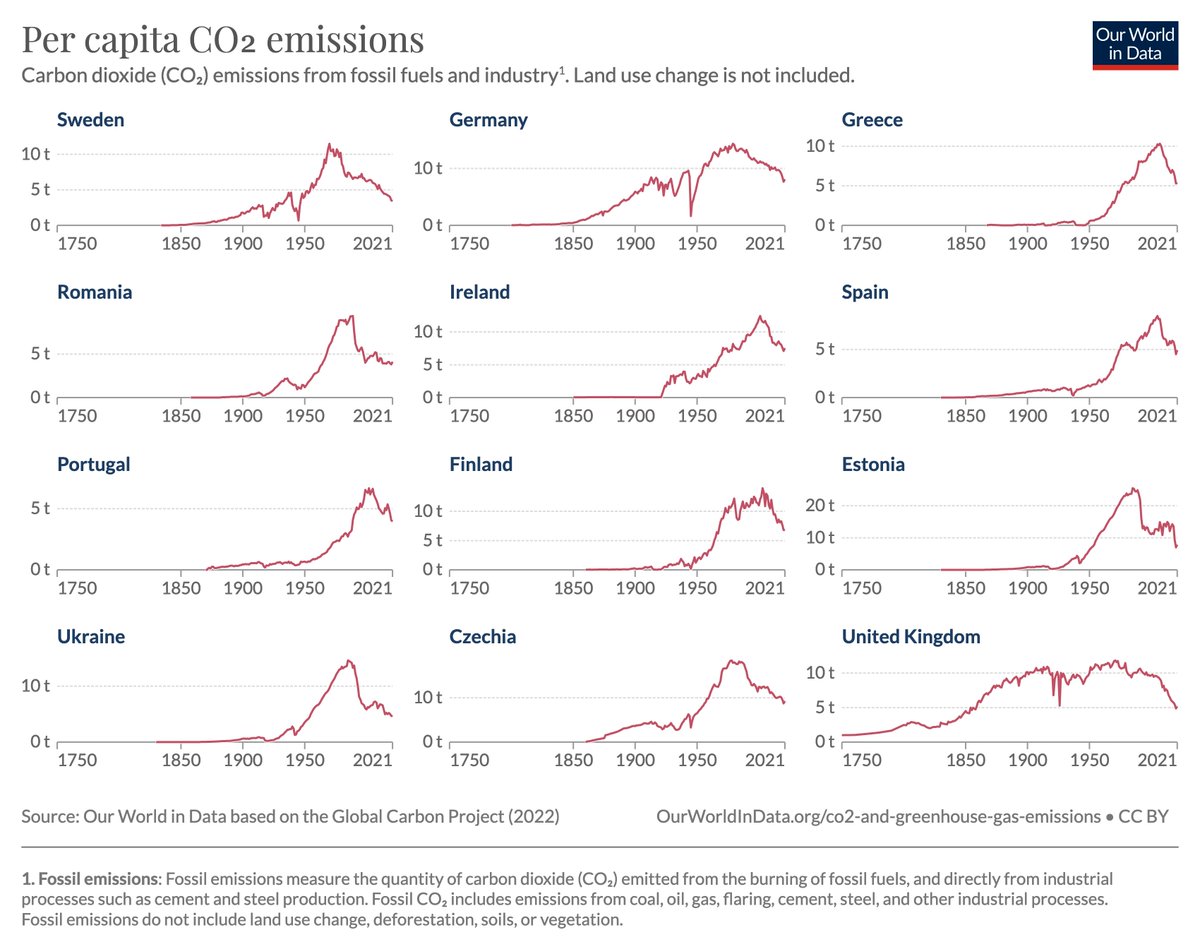
👇It is similar for many other European countries.
Sweden reached the peaked in 1970, the UK in 1971, Germany in 1979. And many other European countries in the time since then.
Here you can explore all our data on greenhouse gas emissions: https://t.co/9qvvZ8JaRW
Zur Erinnerung: Morgen, 18 Uhr, Online-Debatte zu CO2-Entnahme und Speicherung. Welche Möglichkeiten gibt es? Natürliche oder technologische Verfahren? Und sollen wir die Speicherung mit CO2-Preisen vergüten bzw. sie in den Emissionshandel integrieren? https://t.co/kxTt3nSyWX