@adam_tooze Beef PPI at 140 while beer sits below 90. The category spread tells you more about where inflation actually lives than any headline number.
@OKavrak Average wealth tells you where capital is parked. Median wealth tells you where consumer spending power sits. That 10x gap explains a lot about US demand fragility.
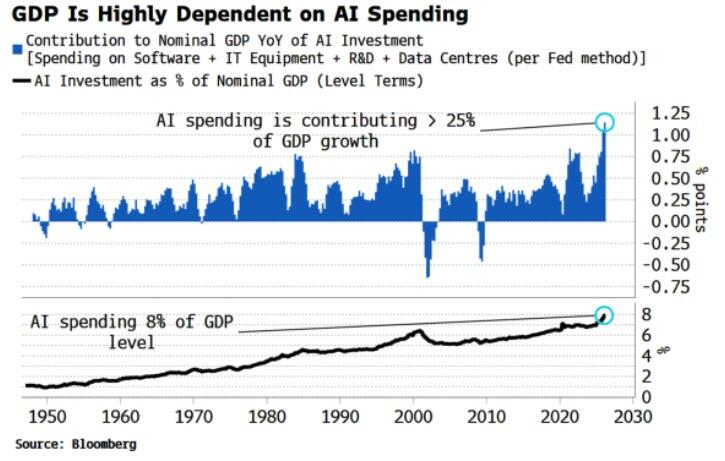
1.5 of 2.0 GDP points from a single capex cycle. I wouldn't call that broad-based expansion. Historical comps for this kind of concentration aren't reassuring.
Ai related spending isn't just important for chip names and momentum traders, it has been the single biggest contributor to GDP in 2025 and 2026.
Should this trend change, it stand to reason GDP would fall. And fall hard! For those interested in just how much Ai related businesses contribute to US GDP, here you go:
👇
In the first quarter, U.S. GDP grew at an annualized rate of 2.0%. AI-related investments in software and IT equipment accounted for 1.5 percentage points of that 2% total, effectively driving roughly 73% of all U.S. economic growth.
Translation: Should Ai related investments stall and sneeze, the US economy catches a cold! 🤧
Source: Simon White, Bloomberg
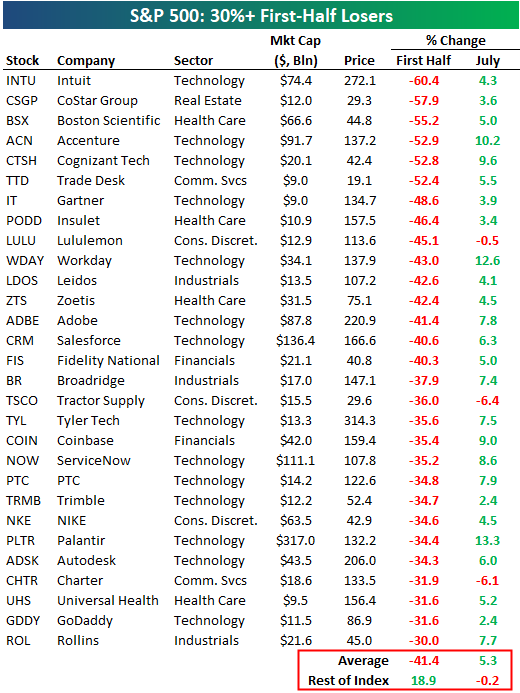
The 50%+ bucket outperforming the 30%+ bucket on the bounce is the tell. Deeper oversold, more short covering, mechanical reflex. I'd watch Q2 earnings to see if this is real or just positioning.
There were 29 S&P 500 stocks that fell 30%+ in the first half. 26 of 29 are up so far in July for an average gain of 5.3%. 👀
The six stocks that fell 50%+ in the first half are all up at least 3% in July for an average gain of 6.4%. 👀
Remember the "tariffs are a tax, consumer is toast" panic last year? I said FCI was loosening and tariffs too small to matter.
Wealth effect is driving this economy. The Fed remains asleep at the wheel.
@kurtsaltrichter The concentration unwind is the signal that matters. Cap-weighted vs equal-weight breakdown preceded every major drawdown since 2020. At these multiples, 5,735 isn't a tail risk.
@Alpha_Ex_LLC Good chart. The VIXEQ/VIX gap is basically the market holding a short correlation position. Those unwinds tend to be violent when they come.
68% of office in special servicing isn't a cycle, it's a structural reset. 2026 cohort hasn't even started repricing yet and 36% is already below the refi viability line.
$2.54B of CMBS loans hit hard maturity this month with no extensions left. Retail is 46% of the wave, and 68% of the office balance already sits in special servicing. Another $76.6B matures in 2026, 36% at debt yields of 8% or below. Data: @TreppWire via @credaily#CRE#CMBS
@AugurInfinity The print reinforces that EM isn't one trade. China stuck in a low-demand loop while Gulf non-oil PMIs hold expansionary. Country selection matters more than EM beta right now.
@IGWTreport@TedJButler@izakaminska Sartori's call on central banks is directionally right. The more striking number is velocity: Tether added nearly 90 tonnes in 2025 alone. That's sovereign-grade accumulation, not a stablecoin hedge.
@FromValue The -3.1% CAGR on forward P/E over a decade where the stock returned how much? Denominator grew faster than the multiple compressed. That's the read.
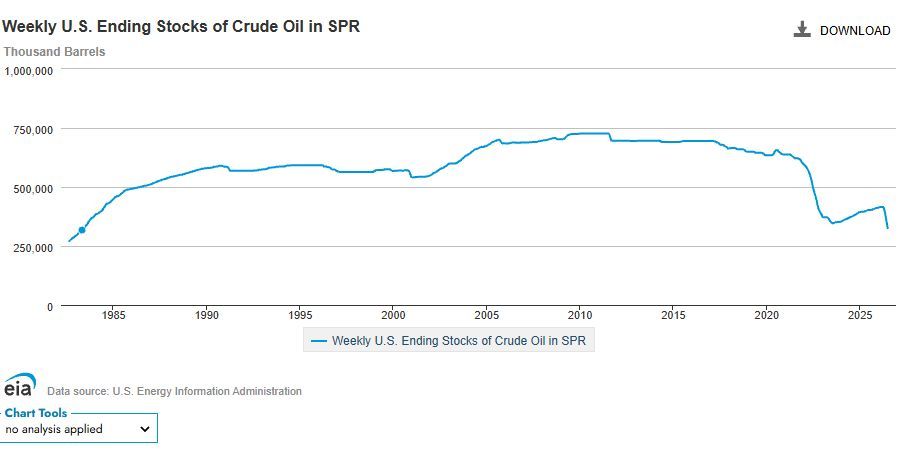
Hormuz passage remains conditional and severely restricted. SPR drawdowns bridged the supply gap, but at ~400M barrels the buffer is nearly spent. Markets are pricing normalcy that doesn't exist on the water.
Sure oil prices fell recently, but most folks don't realize just how reliant that has been on continued strategic inventory drawdowns b/c Hormuz never really fully opened. At this pace weeks away from using up this crucial source of supply