$AUKI | @Auki Keeps Shipping, Bringing Smarter Retail Planograms to @CactusXR
$AUKI is working on integrating product images and dimensions into @CactusXR enabling retailers to create accurate planograms, distribute them directly to stores, and perform planogram compliance checks, all within the Cactus ecosystem. This streamlines retail operations and enhances in-store execution through XR-powered tools.
Really impressive to see $AUKI consistently building and expanding real-world utility.
The team keeps delivering practical innovations that improve operational efficiency and push spatial computing adoption forward.
The steady progress and focus on execution are what set strong projects apart.
Networking, inspiration, and tandoori pizza await at industry group @Intercognitive's foundation event in SF next Thursday.
If you're working on physical AI, don't miss this one!
Nos vamos a 🇬🇧! @fetch_ai_IL presenta: UK AI Agent Hackathon en Imperial College London. Una semana para reunir a algunos de los builders más talentosos del Reino Unido y explorar la próxima frontera de los agentes autónomos impulsados por la tecnología agentic de @Fetch_ai para @ASI_Alliance.
🏆 Los equipos ganadores serán invitados a presentar sus proyectos en el Parlamento del Reino Unido en septiembre. 📅 Fecha: 28 de junio – 4 de julio de 2026.
Durante el hackathon, los participantes podrán experimentar, construir y llevar ideas del concepto a la ejecución utilizando herramientas para la nueva economía de agentes.
¿Querés registrarte o necesitás ayuda durante el hackathon? Consultá al UK AI Hackathon Agent:
https://t.co/zuW4pBofiU
$NEAR has already shown you every level that matters.
The market just forgot.
Three monthly levels have controlled nearly every major turning point in $NEAR history:
$3.3 - the level that capped the first major bounce after the bear market began
$9 - the major distribution zone from 2024
$20 - the area where the 2021 mania topped out before the collapse
Right now, price is sitting below all of them.
Nothing has been reclaimed.
Nothing has been confirmed.
But that’s exactly what makes this chart interesting.
The entire structure is built around one simple idea:
If $3.3 flips from resistance into support, the next major liquidity pool sits around $9.
If $9 gets reclaimed on the monthly timeframe, the chart opens into a large air pocket with very little historical resistance until the $20 region.
And that $20 level isn’t random.
It’s where the biggest concentration of trapped supply from the previous cycle exists.
Most traders will only become interested after those levels are already reclaimed.
The opportunity exists before that happens.
The market spent years compressing after a 90%+ drawdown.
Now it’s approaching the first level that can change the entire higher-timeframe structure.
Watch $3.3.
Everything starts there.
I've trimmed down on size of my daytrade on $NEAR.
Not that I don't think it will work out, but more or less because #Bitcoin is quite shaky on its feet at this point.
If Bitcoin tests those lows, it will automatically trigger a cascade of downward pressure on the altcoin markets, which means we have an opportunity to buy strong positions at lower levels.
I would be favoring that for $NEAR and I'm definitely going to be buying the dip.
However, if this level holds and the markets turn upward, I'm sure $NEAR will be one of the strongest assets.
Working on getting product images and dimensions into @CactusXR so retailers can design planograms, push them to stores, and do planogram compliance checks all within Cactus. 🌵
Dammn...
$1.65 Trillion has been wiped out from gold and silver in the last 18 hours.
This is more than the entire market cap of Bitcoin and ETH combined.
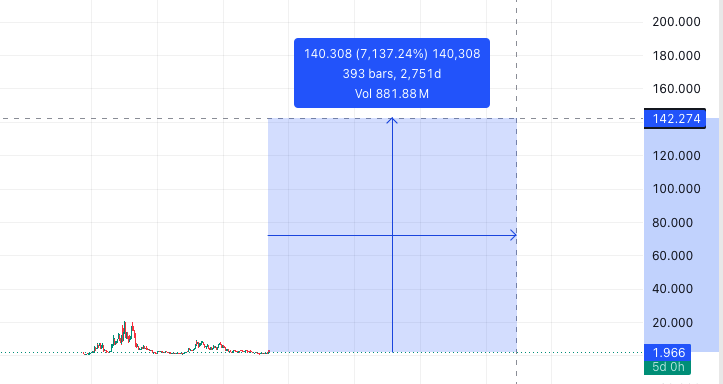
$NEAR ALREADY SHOWED THE ROADMAP
Most traders are waiting for confirmation
The chart is showing what happens after confirmation
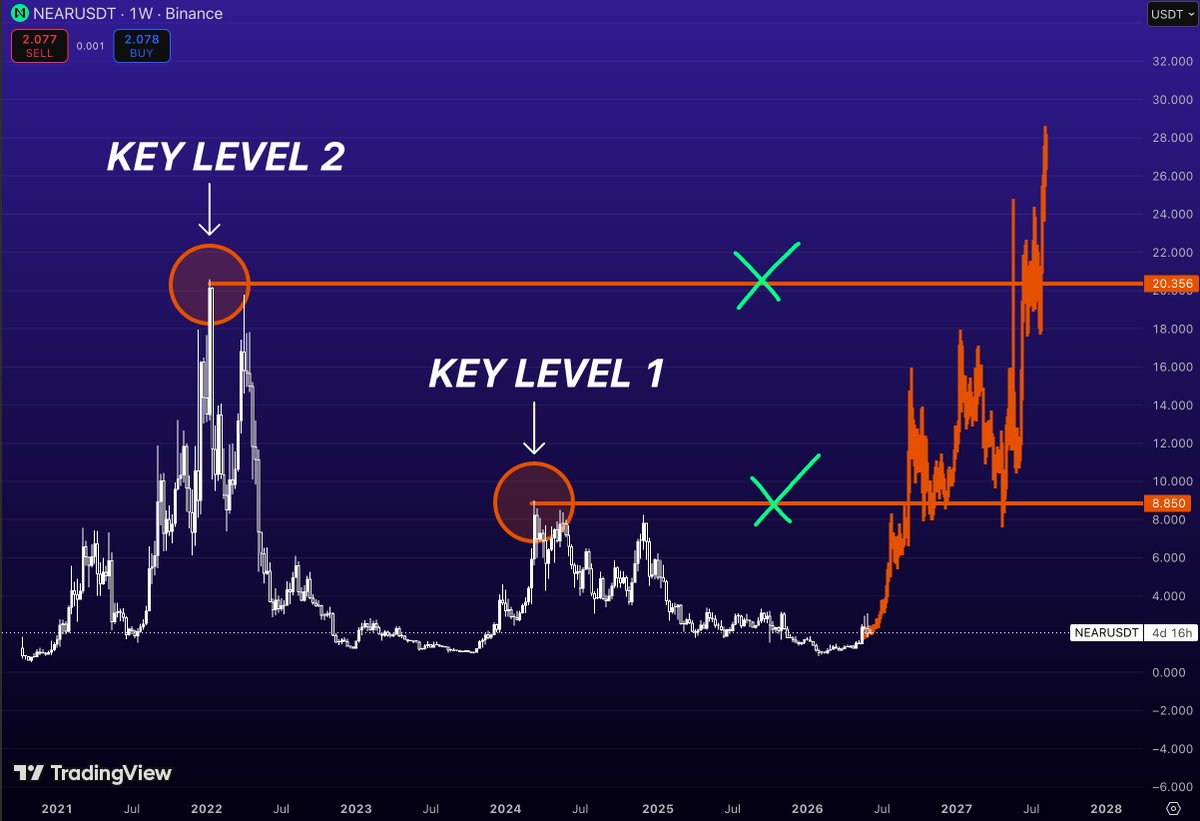
$NEAR has two major historical levels that stand out on the weekly:
$8.85 - the first major supply zone
$20.35 - the cycle-defining resistance
What’s interesting is that these aren’t random targets
They’re the exact areas where previous rallies lost momentum and where the market spent months distributing before collapsing
Now imagine $NEAR starts reclaiming them one by one
First comes $8.85
That alone would represent a move of roughly 4x from current prices
Then comes the real test
The $20.35 region
A level that acted as a ceiling during the strongest phase of the last cycle and where an enormous amount of trapped supply was created
If buyers can absorb that liquidity, the market enters price discovery territory again
Right now everyone is focused on what’s happening around $2
The bigger picture sits much higher
And the distance between those two realities is exactly why charts like this become interesting
Use Claude Fable 5 for free with Virtuals Protocol.
We are deploying up to $400,000 in inference credits, backed by the full Virtuals EconomyOS agent stack.
Not sure where to start? Start with the top builder examples below.
What are you building? 🧵