@dampedspring I think this is a generally accepted "good assumption," but I don't think that expectations, or thereby pricing of other structures, are *actually* built on that stitched-together probability density. The only people who stitch together the implied PDF are doing it for fun.
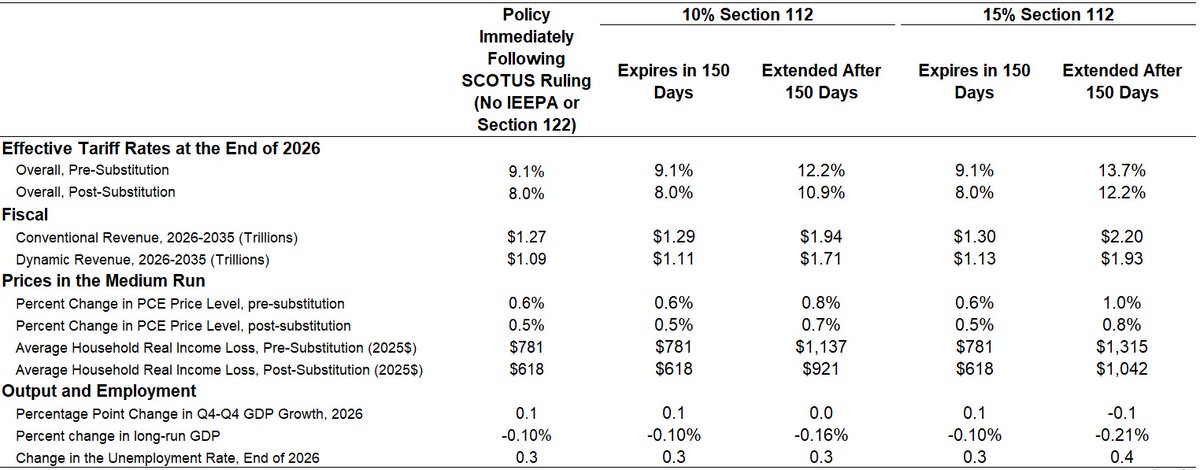
New estimates from @The_Budget_Lab including the possibility of 15% section 122 tariffs (which at the moment I believe only exist in tweet form). Everyone tip @riccoja so he doesn’t have to pay taxes on it.
Only a slight movement up in overall ETR which reflects the exemptions.
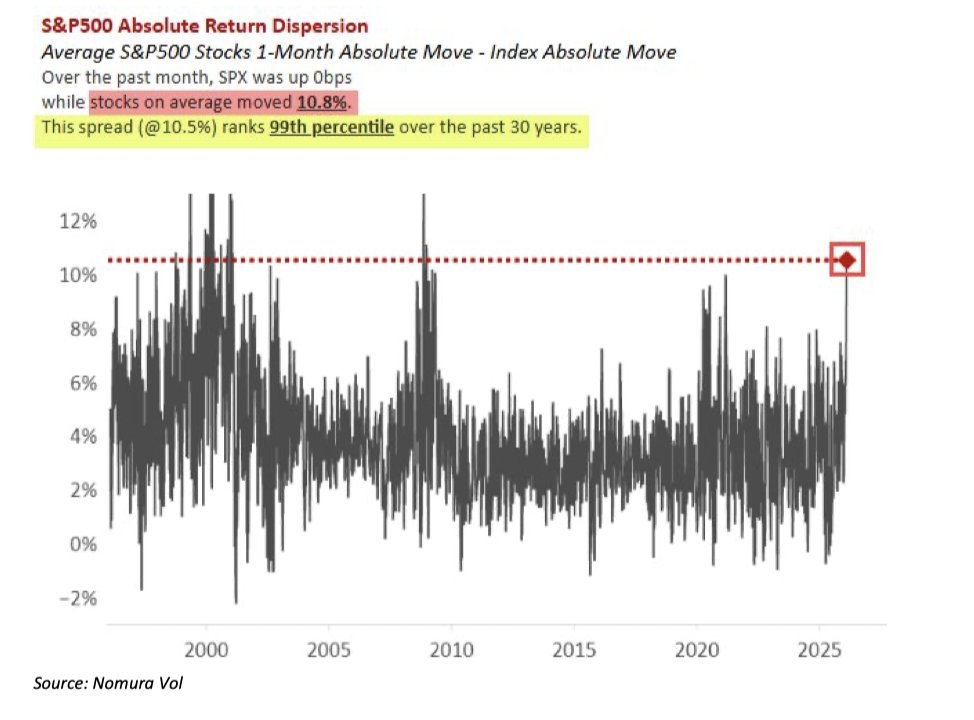
S&P is flat over the past month, but the average stock moved 10.8% — a dispersion spread at the 99th percentile over 30 years. Crushed correlations (1m rCorr 8.9) driven by massive Growth-to-Value rotation, pod shop de-risking at 100th %ile gross leverage, and 0DTE/leveraged ETF amplification have made dispersion trades (long single-stock vol, short index vol) wildly profitable. The catch: prior 99th %ile dispersion events have historically clustered around major market shocks, with the backtest showing ugly negative median SPX returns in the t+2m to t+3m window. Small sample (n=8), but a clear caution flag. Source is Nomura:
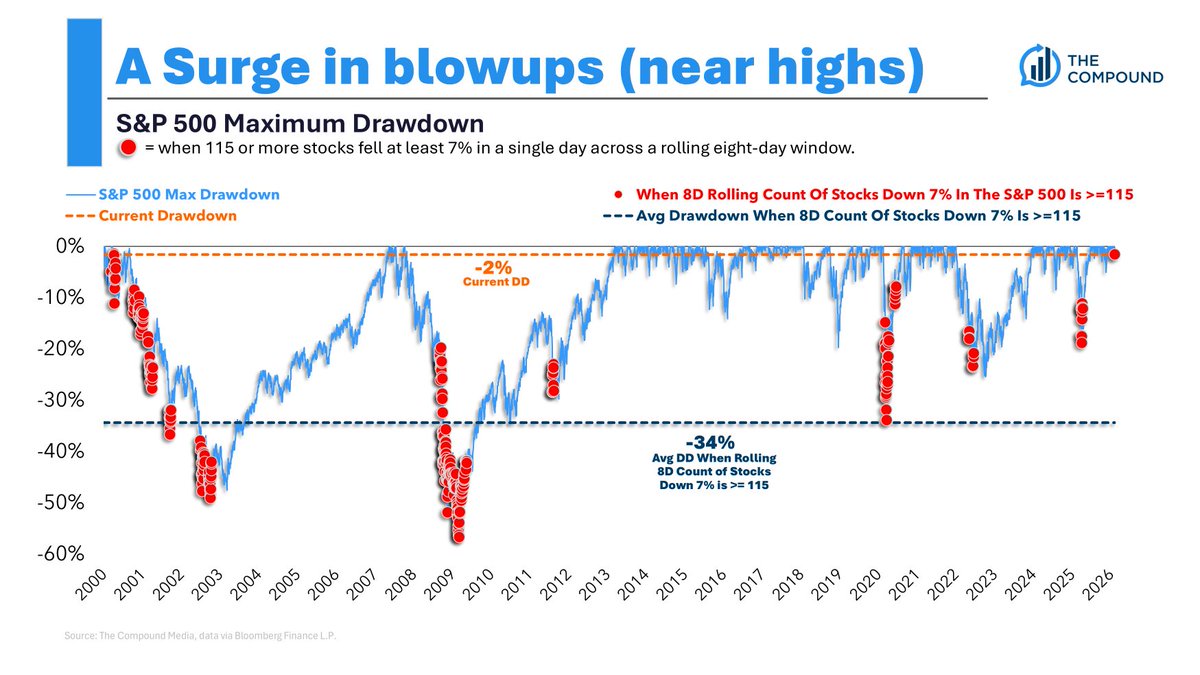
Wild market. We haven't seen anything like this since the dotcom bubble burst.
Over the last 8 sessions, 115 stocks in the S&P 500 have decline 7% or more in a single day.
The average drawdown when that happens is 34%. Right now we're 1.5% below the all-time high.
We can have bad days and scary headlines, that happens.
But as we've been saying for years now, this is a broad-based rally that likely has a lot longer left to it.
Nice one from @granthawkridge in his note today that shows various advance/decline lines making new highs.
The average Russell 1,000 software stock needed to gain more than 50% to get back to its average analyst price target coming into today. Here's a look at the names the farthest below their price targets: