https://t.co/ZrwcDvrJWb
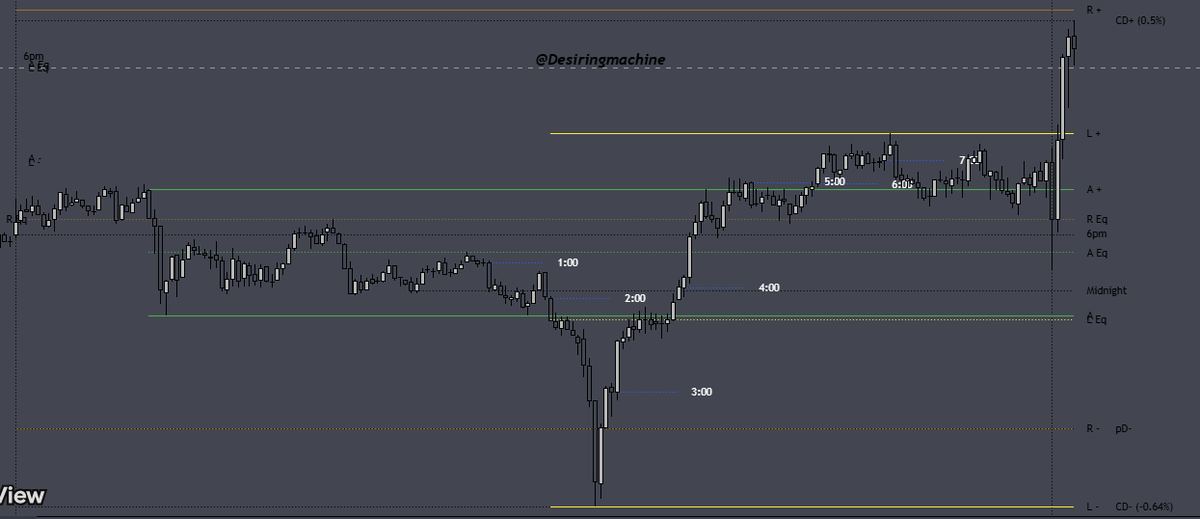
New vid for the new site on "Price Distributions". "Price Distributions" is a statistical framework I use to tell what regime we are in, what my bias should be (trend vs mean reversion), and when to time my entries. It uses percent net change from open to close of various time windows to calculate samples and derive data from said sample.
The Week-1 Tell: How Index Futures (#NQ_F#ES_F Behave Around the Prior Month’s High and Low
Why monthly highs and lows matter
The previous month’s high (PMH) and low (PML) are among the most-watched higher-timeframe levels in the index-futures complex. A plausible reason — consistent with, though not proven by, this data — is that money is managed on a monthly cycle: funds report exposure, P&L, and risk monthly, so stops, trailing logic, and month-end rebalancing tend to concentrate around last month’s extremes. Whatever the cause, price interacts with these two levels — sweeps them, reverses off them, returns to them — with enough regularity that the behavior is measurable. That’s what this study measures.
The question this study answers is practical: given only what you know by the end of the first week, what are the odds the month closes green — and that it returns to last month’s high before it’s over?
We pulled twelve years of full-session futures data and tested every common claim about monthly behavior. Several popular ones collapsed under the data. A few quiet ones turned out to be the strongest signals we found. Here’s all of it.
The baseline (read this first)
Before any conditions, across all 587 months, these are the raw frequencies. Every number later in this article should be measured against them — a “75% setup” only matters if the baseline is 60%.
The headline here: the prior high gets retested nearly twice as often as the prior low (66% vs 36%). In a market that grinds upward over twelve years, last month’s high is roughly double the magnet last month’s low is. Keep that asymmetry in mind throughout.
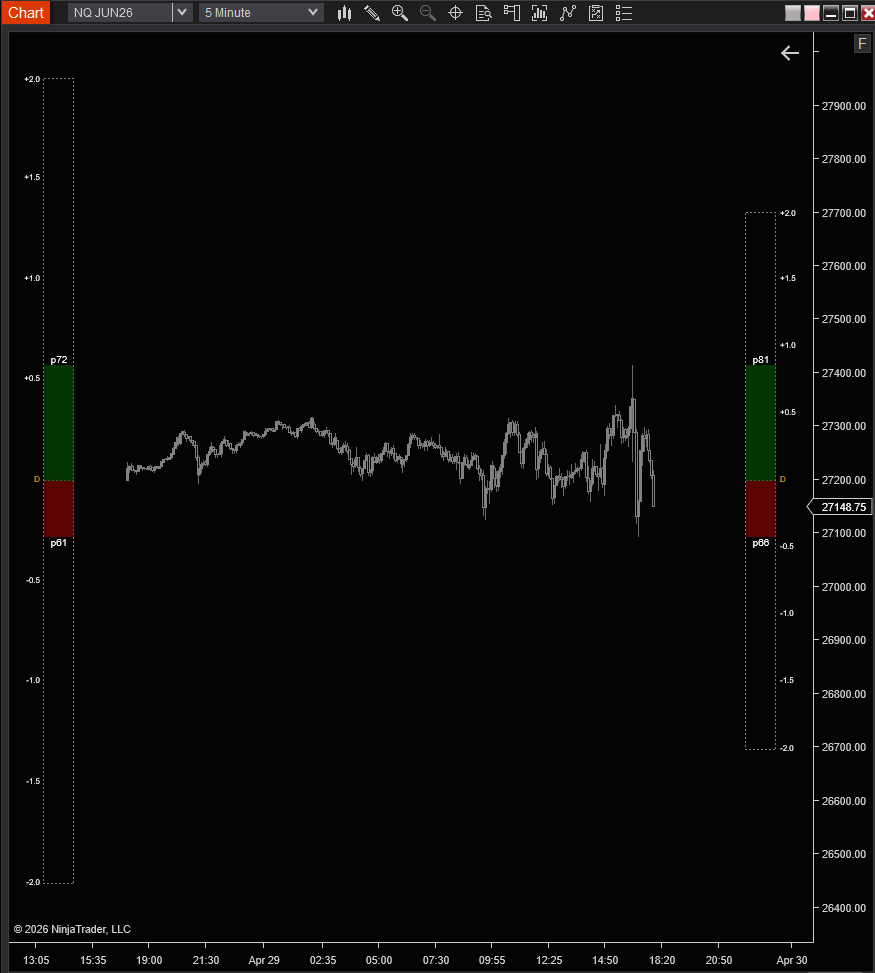
5yr session distribution on the left, 20-day session distribution on the right, current session in the middle. 20-day is compressed relative to the 5yr. What does this mean?
This means recent volatility is below the long-term baseline. The market has been quieter than usual over the last month, despite the uptrend to new all time high. Currently in a compression / consolidation regime in terms of vol. Range bound tape, lower ATR, tighter daily ranges, etc.
Compressed vol historically resolves into vol expansion, and often violently. The trend continues until it doesn't, and when the regime breaks, you get sharp moves that blow through the narrow rolling bands. That's the "vol of vol" risk. Expecting outlier days here soon, don't let it catch you off guard when it happens.
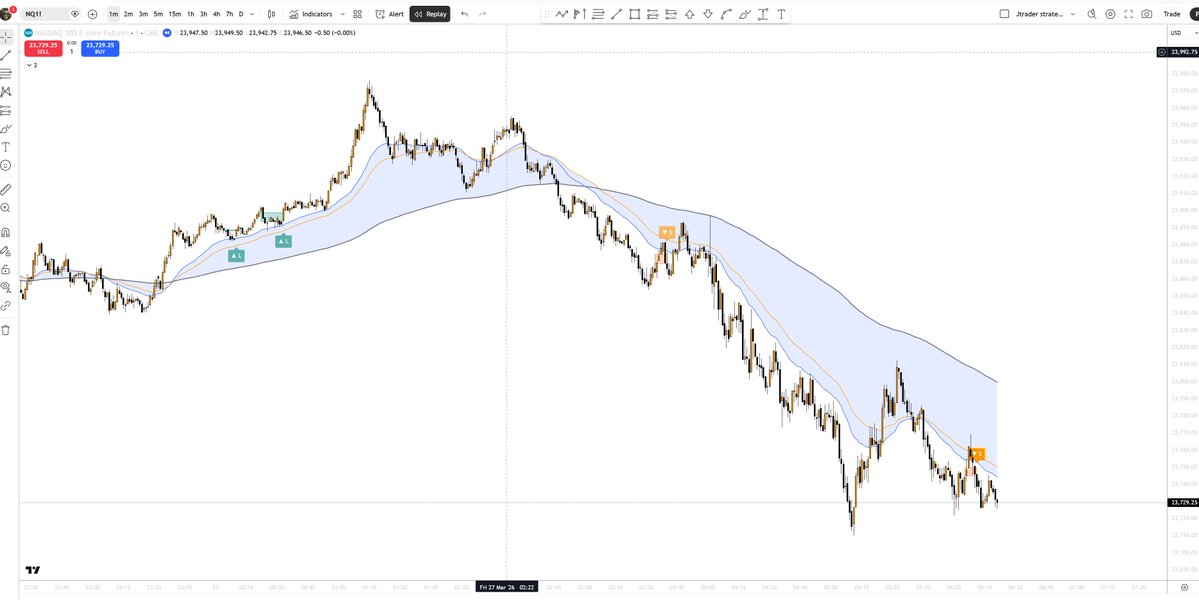
Going after paid alert indicators and open-sourcing them 😄
This time: EMA inversion from @jtrader
Simple idea (EMA + inversion) but surprisingly decent P&L even without tweaks
I added my own twist (3-candle rotation)
Open source indicator:
https://t.co/NWmPOrCoMX
Strategy + P&L:
https://t.co/M5LMGmndgi
Honestly worth exploring further
might run some ML to filter and isolate the A+ setups via Python
Credit to @jtrader for the idea
Less for putting alerts behind a paywall
Open-source → real stats, real validation
I put together the following example strategy simply to demonstrate how a few straightforward requirements built around a statistical edge can be used to form a strategy.
https://t.co/dHQUmoHIQI