Maybe it is time for us to look beyond Transformers.
Some of the most important operators in future AI systems may not be attention layers. They may be classical ML primitives: KMeans, KNN, PCA, SVD, clustering, running inside fast agentic loops.
Old algorithms. New workloads. Modern hardware. Check out talented @Andy_ShuoYang 's post and blog: https://t.co/LZKv3rfWyJ
For over a decade, we’ve accepted that end-to-end backprop is the only way to train deep networks. But holding the entire network in memory all at once is why AI training is hitting a resource wall.
We found a new way to break the network into blocks and train them independently. The trick? Treating the network’s forward pass like a diffusion model denoising a signal.
This reinterpretation slashes the memory needed to train deep models. In our #ICLR2026 paper (https://t.co/PK5h0mqQSo), we matched end-to-end performance across ViTs, DiTs, and LLMs. We did this while training just one isolated block at a time.
Most human tasks are not Markovian, the optimal next action cannot be determined solely by looking at the current state. It depends heavily on the past trajectory, the original intent, and context constraints. An agent that cannot compress and track its past trajectory with absolute fidelity is maybe 20% as useful as one that can.
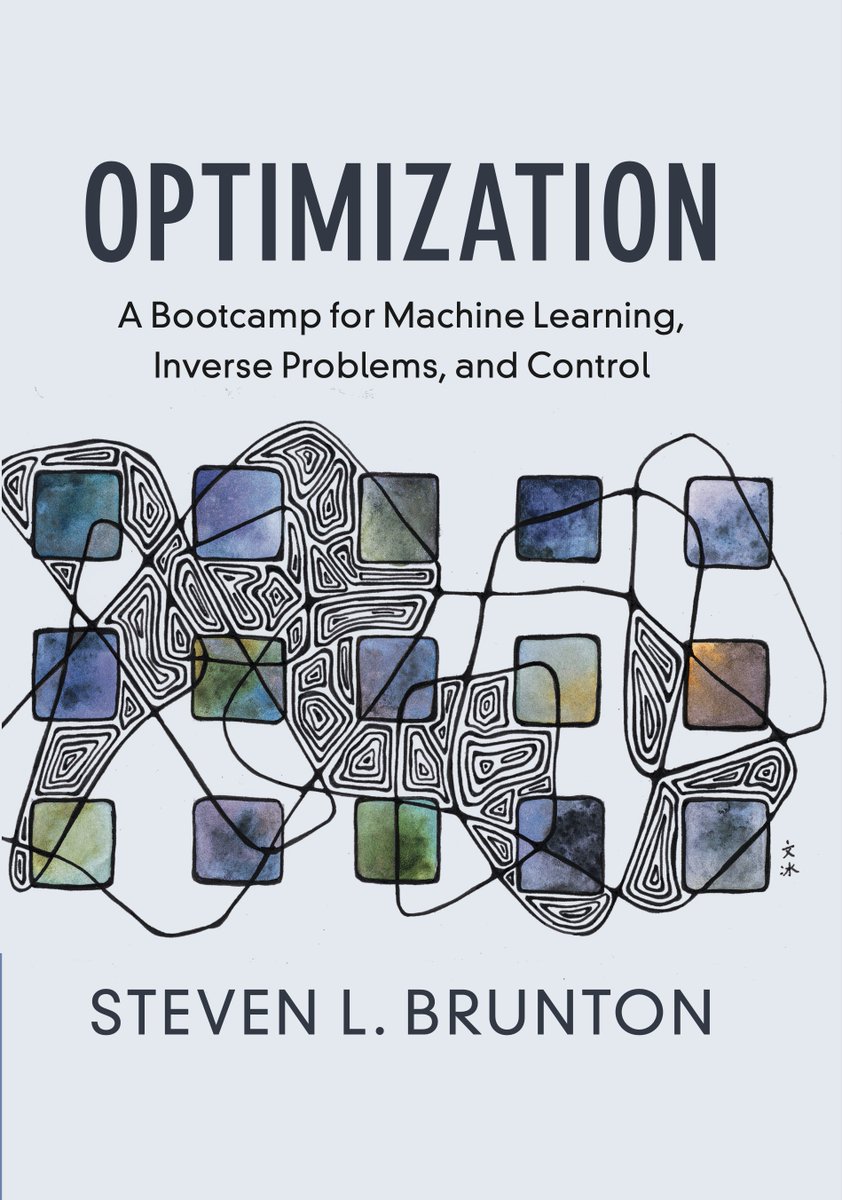
I Wrote a New Book!!!
Optimization: A Bootcamp for Machine Learning, Inverse Problems, and Control
Pre-Order Now (July 31)
https://t.co/EoDMFapUUf
Coming Soon:
* Free PDF on website
* YouTube Videos for entire book
* Python code on GitHub
A new batch of modules in the Statistics Globe Hub is about to start.
We have already completed the first ten modules, and I am excited to announce the next ten topics. The first new module will be released next Monday. Thank you for all your suggestions. I have incorporated as many of them as possible.
Upcoming topics for the next ten weeks:
🔹 Posit Assistant: AI Coding Integrated in RStudio
🔹 The Grammar of Graphics with ggplot2 in R
🔹 Missing Data Mechanisms
🔹 Best Practices in R Programming
🔹 Raincloud Plots in R
🔹 Data Joining Techniques with dplyr in R
🔹 Ridge, Lasso, and Elastic Net Regression
🔹 Chat with LLMs Using ellmer in R
🔹 Interactive Data Exploration with PyGWalker in Python
🔹 Propensity Score Matching
The image below gives you a preview of some of the graphs and topics we will explore in the coming weeks.
By joining the Statistics Globe Hub, you will get access to all of these modules as they are released each week.
Not a member yet? The Statistics Globe Hub is an ongoing learning program focused on practical skills in statistics, data science, AI, and programming with R and Python. A new module is released every Monday.
More information about the Statistics Globe Hub: https://t.co/NA2b7UAXJ4
#rstats #Python #DataScience #MachineLearning #Statistics #AI #StatisticsGlobeHub
I find myself repeatedly explaining the difference between open-weight (DeepSeek), open-source (Olmo), open-development (Marin). Let's see if this restaurant analogy helps:
- Open-weight: food is made behind closed doors, server brings you the dish
- Open-source: food is made behind closed doors, server brings you the dish and the recipe
- Open-development: you see the chef make the dish in the kitchen (and can shout suggestions while its cooking)!
Old television, known as CRT (Cathode Ray Tube) TVs, were essentially big, vaccum-sealed glass bottles that used a beam of electricity to "paint" pictures on the screen.
AI-native software engineering teams operate very differently than traditional teams. The obvious difference is that AI-native teams use coding agents to build products much faster, but this leads to many other changes in how we operate. For example, some great engineers now play broader roles than just writing code. They are partly product managers, designers, sometimes marketers. Further, small teams who work in the same office, where they can communicate face-to-face, can move incredibly quickly.
Because we can now build fast, a greater fraction of time must be spent deciding what to build. To deal with this project-management bottleneck, some teams are pushing engineer:product manager (PM) some teams are pushing engineer:product manager (PM) ratios downward from, say, 8:1 to as low as 1:1. But we can do even better: If we have one PM who decides what to build and one engineer who builds it, the communication between them becomes a bottleneck. This is why the fastest-moving teams I see tend to have engineers who know how to do some product work (and, optionally, some PMs who know how to do some engineering work). When an engineer understands users and can make decisions on what to build and build it directly, they can execute incredibly quickly.
I’ve seen engineers successfully expand their roles to including making product decisions, and PMs expand their roles to building software. The tech industry has more engineers than PMs, but both are promising paths. If you are an engineer, you’ll find it useful to learn some product management skills, and if you’re a PM, please learn to build!
Looking beyond the product-management bottleneck, I also see bottlenecks in design, marketing, legal compliance, and much more. When we speed up coding 10x or 100x, everything else becomes slow in comparison. For example, some of my teams have built great features so quickly that the marketing organization was left scrambling to figure out how to communicate them to users — a marketing bottleneck. Or when a team can build software in a day that the legal department needs a week to review, that’s a legal compliance bottleneck. In this way, agentic coding isn’t just changing the workflow of software engineering, it’s also changing all the teams around it.
When smaller, AI-enabled teams can get more done, generalists excel. Traditional companies need to pull together people from many specialties — engineering, product management, design, marketing, legal, etc. — to execute projects and create value. This has resulted in large teams of specialists who work together. But if a team of 2 persons is to get work done that require 5 different specialities, then some of those individuals must play roles outside a single speciality. In some small teams, individuals do have deep specializations. For example, one might be a great engineer and another a great PM. But they also understand the other key functions needed to move a project forward, and can jump into thinking through other kinds of problems as needed. Of course, proficiency with AI tools is a big help, since it helps us to think through problems that involve different roles.
Even in a two-person team, to move fast, communication bottlenecks also must be minimized. This is why I value teams that work in the same location. Remote teams can perform well too, but the highest speed is achieved by having everyone in the room, able to communicate instantaneously to solve problems.
This post focuses on AI-native teams with around 2-10 persons, but not everything can be done by a small team. I'll address the coordination of larger teams in the future.
I realize these shifts to job roles are tough to navigate for many people. At the same time, I am encouraged that individuals and small teams who are willing to learn the relevant skills are now able to get far more done than was possible before. This is the golden age of learning and building!
[Original text: https://t.co/1pUxNC5UXk ]
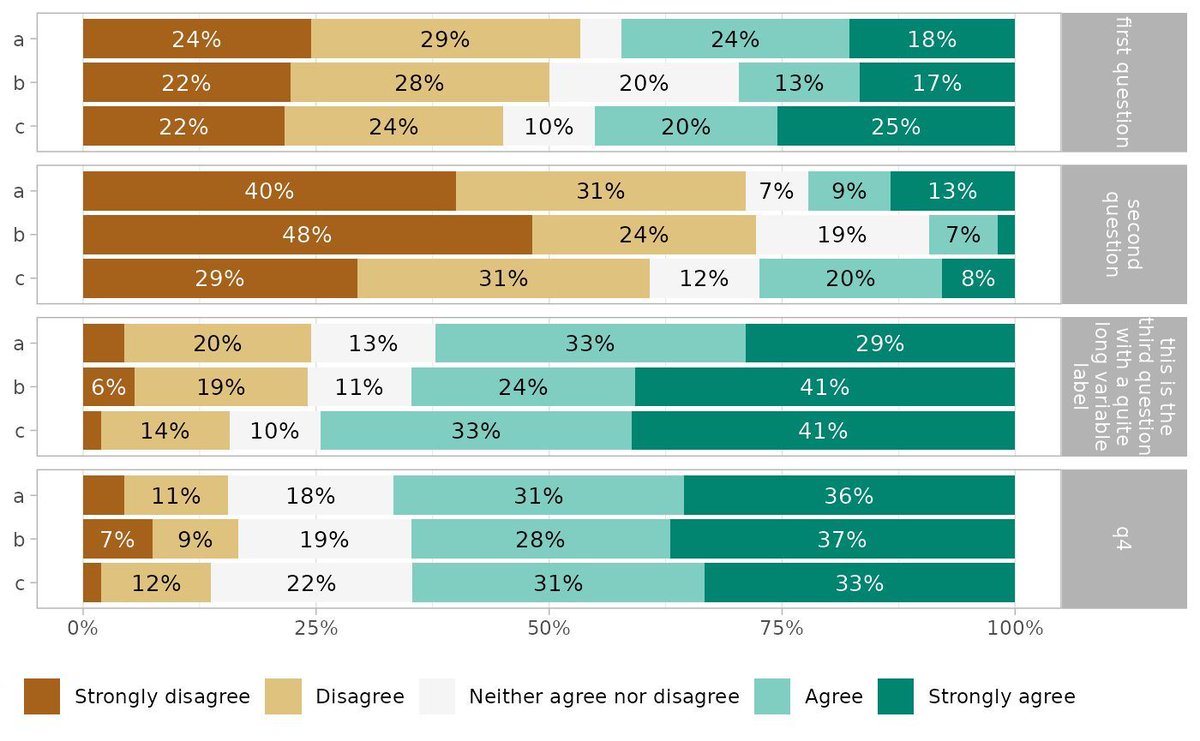
Visualize Likert-type survey data with ease using ggstats and its gglikert() function. Whether you're analyzing responses to survey questions or exploring patterns in attitudes and opinions, gglikert() provides a clear and effective way to represent Likert-scale data in R.
Why use gglikert()?
✔️ Tailored for Likert data: Specifically designed to handle Likert-type items, ensuring a structured and interpretable visualization.
✔️ Detailed insights: Displays distributions of responses, making it easier to understand trends and group differences.
✔️ Customizable plots: Leverages ggplot2’s flexibility to adapt the appearance to your needs and preferences.
The visualization included here originates from the ggstats documentation, showing how gglikert() can transform survey data into meaningful insights: https://t.co/ZrEMomuMWm
Want to take your data visualization skills further and explore tools like ggplot2 and its extensions? Check out my online course, "Data Visualization in R Using ggplot2 & Friends!" See this link for additional information: https://t.co/ztlEzoEDWv
#ggplot2 #DataVisualization #Statistical