Registration is now open for the 20th North American Meeting of the Urban Economics Association!
Join us in Chicago on September 25–26, 2026, at the Federal Reserve Bank of Chicago.
Register here: https://t.co/sx2yUTDNqO
Tsunami warning systems fail at the worst moment, when a big quake floods one central server with data. The fix is to stop centralising.
Sometimes, when the seabed lurches off a coastline, the town onshore might have ten or fifteen minutes before the water arrives. A surprising slice of that window gets eaten by 'plumbing': i.e. readings travelling from sensors to a central server, queuing for processing, and the verdict travelling back. A new framework cuts the processing part to between 50 and 60 milliseconds, faster than a blink.
The trouble with tsunami warning is that it's a race against a wave you can't slow down. The water moves at a fixed pace set by ocean depth, so every second saved in detection is a second more for people to reach high ground. Older warning systems were built like most data systems of their era: sensors phone home to one big control centre that crunches everything in one place. That design buckles exactly when you need it, during a large seismic event when thousands of instruments light up at once and the central system slows under the flood of incoming data.
RT-EDAP, from a group of Indian engineering researchers, rebuilds the pipeline around the opposite principle. Instead of shipping every raw reading to a distant server, it does the first pass of the work right next to the sensors, an approach called edge computing. Lightweight models on local hardware screen the seismic, tide-gauge and GPS feeds on the spot, so only meaningful events travel onward rather than a constant stream of background noise. That alone strips out most of the delay and most of the network load.
Behind that sits machinery built for handling continuous floods of data, the same stream-processing tools, Apache Kafka and Apache Flink, that companies use to track millions of live events a second.
Here they marshal the sensor feeds so the system scales smoothly as readings surge instead of choking. The actual call on whether a quake will spawn a tsunami goes to a model that reads each sensor's signal as a sequence over time, watching how the ground motion or sea level evolves across seconds and minutes, the pattern that separates a dangerous event from a harmless tremor.
Put together, the authors report 95% accuracy at classifying events, with that 50-to-60-millisecond processing time holding even as the event rate climbs. The accuracy figure matters as much as the speed, because a warning system that cries wolf trains people to ignore it, and the cost of evacuating a coastline for nothing is measured in millions and in lost trust. A fast warning that's also a false one can be worse than no system at all.
That said, there are a bunch of limitations to flag. This is a systems-and-software result, validated on data and load tests rather than a real ocean disaster, and the gap between a benchmark and a live tsunami is exactly where warning systems tend to fail.
But I reckon the architectural shift it represents is the right one. The old model of hauling all your data to one place to think about it is giving way to thinking at the edge, where the data is born, and for problems measured against a moving wave that change is worth more than any single accuracy score. The next big tsunami will be met by a system that does most of its thinking before the old one would have finished dialling home.
link to full article: https://t.co/0CVgpAqHhn
figure
@TheEconomist highlights the world's top "AI-pilled economists." EconTAI Faculty @akorinek and @BasilHalperin are among the small group driving real research on AI's economic impact.
🔗Read the full article: https://t.co/t6bSQmQkY4
Quote: "The Anthropic Institute’s goal is to tell the world what we’re learning about these challenges as we build frontier AI systems, and to partner with external audiences to help address the risks" https://t.co/nZhv9nv9V2 2/3
Some news: As of June 30, I'll be on leave from Stanford at Anthropic. I'm joining the Anthropic Institute, where I'll continue my research on AI and our economic future and give seminars and talks as always. 1/3
The "literature" is going to become a collection of nodes/papers representing temporarily suspended computation with "citations" being contingent edges that describe how they sink uses the source; new data, better models & methodological changes will cause a Makefile-like cascading of update through the literature/graph. AI agents will autonomously add new edges + nodes.
Así funciona un MCP para QGIS: le pedí que hiciera un análisis multicriterio, y él solo tomó las mejores decisiones, se puso a trabajar e incluso aplicó la simbología. Esto lo puedes aprender en el curso "QGIS 4 con IA", que se desarrollará en línea en agosto de 2026: https://t.co/u9FpqNPdy8
🧠 EconTAI co-organized the Economic Scenarios for Transformative AI Workshop with @windfalltrust and @PIIE this week, bringing together 40 leading economists, policymakers, and AI researchers to game out policy responses to AI’s biggest economic risks.
I think my rule of 10 hours of using AI for real tasks is true, but a lot of people find the first hour hard and never learn what these systems can do before putting it in a small box (“kind of like Google”)
The best flood-mapping AI may be the one we stop allowing to invent impossible water.
Most satellite flood maps do one thing well: they show where the water appears to be. Take Sentinel-1 radar, add optical imagery when clouds allow, classify each pixel, and produce a flood mask.
I guess that’s useful during a disaster, but it leaves out some pretty important factors - how deep the water is, how fast it’s moving, and whether the flood pattern makes physical sense.
A new paper tackles that harder problem.
They present a model which combines Sentinel-1 radar, Sentinel-2 optical imagery, and terrain information from a digital elevation model. That terrain layer includes elevation, slope, and HAND, which measures how high each location sits above the nearest drainage path.
Then the authors use a hybrid architecture: UNet plus FNO.
UNet is pretty good at local details. It can pick up flood edges, roads, urban structure, and small changes in inundation patterns. FNO is better at broader spatial relationships, such as upstream-downstream structure and basin-scale flow.
That combination is useful because floods don’t happen at one scale. A road embankment can shape the water in one neighbourhood, while the slope of the whole floodplain controls where the water wants to go.
But what I find to be the strongest part of the paper is the discussion on physics loss.
The model predicts water depth and velocity, then training checks those predictions against the depth-averaged shallow-water equations. In plain terms, the model gets penalised when it draws floodwater that looks plausible in an image but breaks the rules of mass, momentum, slope, and friction.
That constraint appears to do real work.
Across three held-out floodplain regions, the hybrid model reached an IoU of 0.82 and an F1 score of 0.90.
The depth results are more interesting. Evaluated against HEC-RAS hydrodynamic simulations, the hybrid model reached a water-depth RMSE of 0.21 m.
For flow velocity, the hybrid model reached 0.15 m/s RMSE. It also kept relative mass imbalance down to 2.1%, which is exactly the kind of check you want when a model is pretending to understand water.
Anyway, it looks like the trend is that flood AI models is moving from image classification to physical state estimation. This essentially resembles more traditional hydraulic modelling approaches to the problem. Maybe we're coming full circle...
Link to paper: https://t.co/VVa9CtWhHi
(Image source: UN Spider)
This is a super exciting release - Claude Fable 5 is the same underlying model as Mythos but with added safeguards. The benchmarks are great and it's SOTA on everything by a margin but I'll add that *qualitatively* also, this is a major-version-bump-deserving step change forward (imo of the same order as Claude 4.5 was in November), peaking especially for long problem-solving sessions on very difficult problems. You can give it a lot more ambitious tasks than what you're used to, the model "gets it" and it will just go, and it's never felt this tempting to stop looking at the code at all (but don't do this in prod!). The model still has quirks that people will run into and the safeguards are configured to be a little too trigger happy for launch, which can hopefully be tuned over time.
I feel a lot of things changing as working software increasingly comes out on a tap. The Jevon's paradox kicks in and I feel my own demand for software growing substantially. You can ask for anything - explainers, visualizers, dashboards, bespoke single-use apps (e.g. a full wandb that is hyper-specific just for your project), you can 10X your test suite, auto-optimize code, run giant research projects with custom HTML for the results, anything! "Free your mind" (Matrix ref). Really looking forward to all the things people build!
Dear followers,
Please see this discussion on AI and future work between myself, @deanwball@emollick and @clarashih
Somehow, I was again the least optimistic person in the debate.
In the Hybrid A.I.-Human Work Force, Who Will Actually Thrive? — NYT https://t.co/FTRbPMOtvP
A global mining dataset has 44,929 mine polygons. A new paper shows why that still isn’t enough.
The problem is the outline.
From space, mines are often easy to spot: pale scars, roads, pits, waste rock, bare ground, ponds, and disturbed land. But when those features become training data, the labels often turn into rough blobs around the site.
That matters because those boundaries are used to estimate land disturbance, monitor rehabilitation, track deforestation, and assess environmental risk.
If the outline is wrong, the measurement is wrong.
The paper introduces MineC2FNet, a model designed for this exact problem. It starts with a large coarse dataset of global mining polygons, then adds the scarce thing remote sensing models usually lack: expert-validated fine labels.
Only 219 images.
That’s the tension. The researchers have lots of rough labels and a tiny number of precise ones. A normal model can learn the object, but it can also learn the annotation style. If the coarse labels draw mines as smooth blobs, the model starts to learn “mine equals blob.”
MineC2FNet avoids this with a teacher-student setup. The teacher learns broad mining patterns from coarse Sentinel-2 and Landsat data. The student then learns from fine labels, while selectively deciding which teacher outputs are useful enough to keep.
That selectivity is the key. It learns from the big messy dataset without fully inheriting its boundary mistakes.
The domain shift is large. In the coarse dataset, mining coverage peaks around 45% of the image. In the fine dataset, it peaks around 12%. The coarse masks are bigger and smoother. The expert masks are sparse, jagged, and closer to the real footprint.
The results reflect that. On the fine-grained test set, MineC2FNet reaches 92.33% accuracy and 73.64% mean IoU. The closest competitors reach 71.99% and 71.25%.
Strangely, it performs worse against the coarse labels: 44.29% mean IoU versus 72.49% for the coarse baseline. But that’s the lesson. A model can look worse when the benchmark rewards copying bad outlines.
This is bigger than mining. Flood maps, informal settlements, cropland boundaries, deforestation fronts, construction sites, roads, and industrial land all have the same problem: lots of coarse labels, very few good ones.
MineC2FNet treats coarse labels as useful but unreliable. That feels like the right attitude for a lot of satellite-based models.
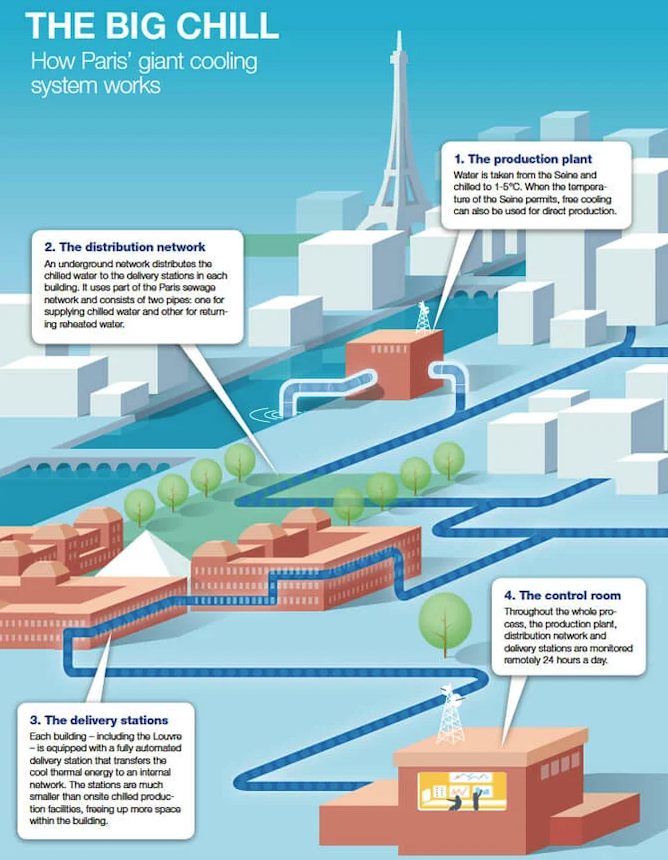
The French hate air conditioning.
So Paris built a 120-kilometre machine under its streets for producing cold.
It’s called Fraîcheur de Paris, and it does for summer heat what district heating did for winter: centralise the problem.
Instead of every museum, office, hotel, hospital and shop bolting its own cooling plant onto the building, Paris moves cold through pipes.
The network sends water chilled to 2 to 4°C through buried supply lines. The water enters a connected building, absorbs heat through an exchange station, then returns at 12 to 14°C to be cooled again.
It essentially functions with two pipes. One carries the cold out, the other carries heat back.
The production plants cool the circuit from 12°C to 4°C. Some sites use the Seine as a heat sink. In colder periods, the system can use the river’s own temperature for free cooling, which means the machines work less and the electricity demand drops. The Seine water doesn’t become the building water. It stays separate, passing temperature across heat exchangers.
The scale is pretty strange when you see it written down though.
It's got 15 production sites, 4 storage sites, 120 km of underground network with 924 subscribers. This has resulted in 7 million square metres cooled, and 493 GWh of cooling sold.
A cold utility running beneath one of the densest cities in Europe.
The Forum des Halles has been cooled this way since 1979. The Louvre since 1986. Galeries Lafayette, Opéra Garnier, Hôtel de Ville, Station F, La Samaritaine and the National Assembly all sit on the same idea. Tourists stand in the Louvre looking at paintings while a municipal cold loop does part of the dull work below ground.
The boring part is the breakthrough.
Cold can be stored at night in chilled water or ice, then used during daytime peaks. The network is monitored from a control room with more than 125,000 control points. A delivery station inside a building takes 5 to 7 times less space than a standalone cooling installation and avoids the roof and façade clutter that turns cities into compressor farms.
That matters because conventional air conditioning solves heat by moving it somewhere nearby. In a dense city, thousands of private machines mean thousands of outdoor units rejecting heat into streets, courtyards and roofs, plus refrigerants, noise, vibration and maintenance spread across every building.
Paris’s public cooling network has a stated coefficient of performance of 4, against 3 for a wet standalone system and 2 for a dry standalone system. Against an equivalent set of autonomous installations, Fraîcheur de Paris says the network gives 100% higher energy efficiency, 35% less electricity use, 90% fewer refrigerant-fluid emissions and 50% lower CO2 emissions.
The climate backdrop is the real reason this exists.
Paris ran a full crisis exercise called “Paris at 50°C” in 2023. Météo-France’s 2050 reference trajectory for France points to heatwave days becoming five times more frequent, hot nights rising sharply in urban centres, and some local extremes around 48°C becoming possible.
The city signed a 20-year concession in 2022 with Fraîcheur de Paris, owned 85% by ENGIE and 15% by RATP. The contract is worth a projected €2.4 billion. The plan is to extend the network by 158 km by 2042, add 20 production plants and 10 storage sites, and reach more than 3,000 subscribers, including hospitals, nurseries, schools and care homes.
This is basically the infrastructure version of admitting that summer is becoming a public systems problem...
Most geospatial vision models don’t fail on satellite imagery because they’re weak. They fail because they learned to see the world from the wrong angle.
Basically, these models learned to see the world from eye level, then got asked to understand it from the sky.
A new Tsinghua paper tackles this with DisDop, a model for open-vocabulary aerial object detection.
Open-vocabulary means the detector isn’t locked to a fixed list of categories. Instead, it can take a text prompt, such as “truck” or “wind turbine”, and search for that object in aerial imagery.
The problem is that most open-vocabulary detectors were built for natural images: streets, kitchens, people, pets, and objects seen from human height. Push them into drone imagery and everything becomes smaller, flatter, rotated, and more ambiguous.
DisDop’s idea is to distil the right knowledge from remote sensing foundation models into a smaller detector.
It uses two teachers.
1. RemoteCLIP helps connect images with language, so the model understands that “wind turbine” and “windmill” are related, or that a text prompt can describe a category it hasn’t explicitly seen before.
2. DINOv3 helps preserve fine local detail, which matters when the target is tiny, rotated, or surrounded by clutter.
One teacher brings language. The other brings shape. DisDop combines both in a lightweight Swin-T detector.
The clever part is actually the context.
A small rectangle beside a road and a house may be a car. A similar patch beside a running track may be background noise. The pixels can look similar, but the surrounding scene changes the meaning.
That’s how human analysts read aerial images. They don’t rely on the object alone. They use roads, roofs, water, fields, tracks, ports, and industrial land to interpret what they’re seeing.
DisDop builds that logic into its distillation process. It transfers visual priors, textual priors, and contextual priors into the detector.
The results are pretty strong.
• On DIOR, DisDop reaches 87.2 AP50, compared with 85.5 for LAE-DINO and 83.6 for GroundingDINO with DVC.
• On DOTAv2.0, it reaches 47.5 mAP, compared with 46.8 for LAE-DINO.
The biggest gains appear where the task is most open and varied.
That’s the important part for Earth observation.
The next step in aerial AI may come from models that can search with language, preserve tiny visual details, and read the surrounding landscape like an analyst would.
Law professors wrote questions they were asked during office hours. Gemini 2.5 & humans answered them then other law professors blindly judged the results:
-Gemini had a 75% win rate vs. professors
-Gemini's answers were rated LESS harmful than humans
-Newer models do even better
Had Claude Code build a snake game where the snake becomes aware it is in the game and then... stuff happens. Some impressive creative decisions by the AI (& also some very AI ones), I just gave a first prompt and some feedback on the game as it went. https://t.co/WdmlBD5iHI