🚨 SAMSUNG, SK HYNIX, AND MICRON ARE GETTING SUED FOR ENGINEERING THE MEMORY CHIP SHORTAGE.
The lawsuit, filed June 25 in California, accuses the three companies of using their pivot to AI memory chips as cover to cut production of regular DRAM, the memory used in everyday laptops and phones.
DRAM prices have risen roughly 500-700% over the past four years. Micron reportedly shut down its consumer DRAM brand, Crucial, at the most profitable price point in its history, a move the lawsuit calls economically irrational unless it was coordinated.
The lawsuit points directly to Apple's recent price hikes on iPads and Macs as evidence the damage is already reaching consumers.
This isn't the first time.
Between 1998 and 2002, Samsung, Hynix, Micron, Infineon, and Elpida ran an actual price fixing cartel, confirmed by US federal prosecutors.
Samsung paid a $300 million criminal fine, Hynix paid $185 million, and Infineon paid $160 million, with several executives serving real prison time, sentences ranging from 4 to 14 months.
The new lawsuit alleges Samsung and SK Hynix later rehired and promoted some of those same convicted executives into senior roles.
Together, the three companies control the vast majority of global DRAM supply today, and building a single new DRAM factory costs $15 to $20 billion and takes years, making it nearly impossible for new competitors to break in and undercut them.
That's the core problem this lawsuit is targeting.
Three companies with total control over a market everyone depends on, the same companies already convicted once before, now facing the same accusation again while prices keep climbing and ordinary buyers have nowhere else to turn.
Jefferies doesn't expect relief anytime soon. Prices are forecast to climb another 40-50% next quarter, then a further 30-40% on top of that the quarter after, meaning prices could roughly double by year end.
2027 is expected to bring another 40-45% increase on top of that, with no real normalization expected until 2028.
Today, I want to talk about a concept I call the initial frontside of the move.
So we established that in low floats/small caps, order books are inherently empty. And when big volume comes into a play, there is quite a lot of uncertainty. How high is the stock going to go? What’s the long entry? What’s the short entry? In the beginning, it is often unclear.
Most short sellers try to create rules of thumb early on in the move to keep them safe. “Don’t short stocks under x%.” “Wait for initial highs to get broken.” “Wait for some type of common topping pattern/higher low break before sizing in.” etc.
Not bad, those rules can certainly save you a lot early losses.
And keep in mind there stocks that make one quick pop, maybe push a new high, then immediately die. There is a lot of variation in this market.
But something to be generally aware of is what I call the initial frontside of the move. This is when a stock initially pops and starts making new highs with consistent and increasing volume, especially on shorter time frames (1m, 3m, 5m, etc.)
This is, by far the most dangerous time to short. Or I should say, it carries the greatest amount of risk. Especially in stronger conditions when the low float market is consistently producing large % moves on a daily basis. But it’s something to be aware of in all markets.
One of the better examples of this concept that happened in a recent strong market is STI from June 4, 2026.
Now there are a few details besides “strong market” that we need to know. The most important of which is the price point and the float. STI falls under what I call “high priced, tiny float” stock. This is usually reserved for plays over $6-ish with quite small floats (<5M-ish)
High priced tiny float stocks have very specific order books which produce a unique type of price action compared to low float stocks of smaller price ranges. I do not have time to go into all the details, and if you really care I cover this extensively in my discord room/patreon, but here are the most important points:
High price tiny float stocks tend to “float” near their highs, like a balloon that’s lost a bit of helium, before potentially squeezing back up higher.
They tend to hold higher lows (often called “bid props”) before pushing new highs.
They also tend to aggressively knife from HoD clearouts and/or long traps near the highs, and have a habit of reclaiming the knife shortly after.
Another important fact about high priced tiny float is they tend to trade on much shorter, more volatile time frames, most notably the 1m and 3m chart, sometimes 5m.
I said in my last post that often in low float stocks, a stock can produce a “bearish” pattern on the 1m chart, only to simultaneously produce a “bullish” pattern on a longer time frame. Notably the 3m/5m for high priced tiny float stocks.
This is especially true on the initial frontside of the move, as a stock is pushing on consistent/increasing volume while making new highs, before any significant pullback.
For STI, we will look at the premarket action early on, before it pushed into $20+.
The FIRST image is fairly easy to understand. We have a high priced, tiny float stock pushing with increasing vol straight up the 1m9ema/1m20ema.
This is the initial frontside of the move. At this point, we have zero idea what the intention is of the stock. Most traders try to derive intention based on the gapping %. They say, “once a stock gets over x%, the intention is to fade the stock back down.” After all, the data shows that stocks that gap up over x% tend to fade (what x% actually is doesn’t matter here, btw. Could literally be any number.)
But short edge is not derived from “shorting things over x%” – it’s derived from understanding how liquidity works, and, more specifically here, how accumulation works.
The increasing volume up the 1m9ema/1m20ema is dangerous, because this is commonly how high priced tiny float stocks accumulate. Because, as I mentioned in my last post, in order for a stock to push up 1000%, you must accumulate at a lower % first.
One thing that more astute traders might have noticed is for stocks that push, say, 500-1000% intraday, they don’t set that many prolonged pullback/consolidation structures.
What I mean is, the way a 1000% intraday runner often pushes is not from pushing 100%, having prolonged period of consolidation (say 45-90+ minutes), then push up to 200%, then another 45-90+ mins of consolidation, then push up to 300%... over and over again until you reach 1000%.
No, the way you do it is you push STRAIGHT UP 200-400% first, trap in ONE prolonged structure, then IMMEDIATELY push to 800-1000%.
The idea behind how this works is very simple:
1. The “rigger” (or MM or w/e we want to call it) accumulates on initial frontside of the move, pushing it to a very high % gap.
2. People start to short the “insane” move. After all, the data shows that stocks over 300% have an X% chance to fade and blah blah blah.
3. The stock stays in the top of the range, often pulling back into the 9ema/20ema on the 3m/5m time frame (this is the time frame the stock is ACTUALLY moving on, although initially we don’t know that yet.)
4. The “rigger” often baits common short patterns on the 1m chart. Hod clearouts get rejected HARD, or higher low pushes right below highs experience HARD knives back to support. Meanwhile, deeper higher lows at support are building, convincing people that a HUGE crack is about to come.
5. After enough trapping and consolidation, the rigger holds the higher lows, and initiates the stock higher, causing a massive squeeze on a tiny float stock through an extremely empty order book.
The SECOND picture below shows how the chart looks like on the 3m chart.
So, as we see here, the initial frontside of the move is not just denoted by the 1m9/1m20emas. The initial frontside of the move can also be done on LONGER time frame MAs. Including the 3m/5m/15m charts. With the 9ema/20emas being the most commonly used.
So, on STI, what they are doing is accumulating on the 3m chart, pushing it straight up the 9ema. The 3m chart is very commonly used on high priced tiny float. Then, after pushing it high enough, they start giving common topping/short patterns on the 1 min, repeatedly rejecting any attempt at making new highs (see THIRD chart). They pull it back to the 3m20ema, and start grinding it higher. After a few more short bait pushes that fail to break highs, they hold the higher lows and initiate the short squeeze through a VERY empty order book.
Btw, in case you forgot what happened, STI not only did STI push to $38 at market open, it also pushed to $57 on day 2 of this move.
One final point I want to make here is low float stocks are moving on multiple time frames, all at once. There are people hyperscalping 15 second moves, there people trading on the 1m, on the 3m, on the 5m, etc. And they all exist simultaneously together. That’s why in my last post I said there is a delicate dance which must be done in low float stocks. Everyone is trying to get their piece, and they are all reading the same price action differently. It pays to study the most common time frames to see how they all line up with each other, and things will start making more sense.
Today’s topic is about edge erosion. A topic I almost never think about, but according to my discord room it’s a popular topic on fintwit, so might as well talk about it.
I believe, fundamentally, edge erosion does not exist, at least not in the way people think it does.
The basic argument people make is this: In small caps, people discover some type of technical pattern or some type of data-driven “edge” in a spreadsheet, and use it to their advantage. Once the data driven pattern gets repeated too often, or the information becomes too “well-known” across social media, the edge “disappears” or gets eroded.
As if there is a secret cabal of market makers keeping tabs on all social media to find out which information is becoming too disseminated or well-known.
Now one thing that absolutely exists in small caps is how market makers abuse recency bias in day traders, especially after a major outlier/extreme event. I will talk about this some other time. But this is not the same as edge erosion.
The reason edge erosion doesn’t exist in small caps is because edge is not derived from trading some repeatable technical pattern or “following the data” (data, which in 99.9% of situations, is oversimplified and over-generalized, to the point of being near useless. For example, did you know premarket gappers often fade? Wow!).
Btw, true fact, the more commonly held a belief exists on small cap twitter, the less edge it produces. You could even say commonly held beliefs on here produce negative edge. Since, after all, 99% of people in this space never make money.
True edge comes from understanding how liquidity in small caps works. And that is the only constant changing force, liquidity. As liquidity changes (this includes both the liquidity in the small cap market itself (the “conditions”), and liquidity in the individual stock you are trading) – the patterns change. Or I should say, the potential for certain liquidity moves to happen changes.
Because, after all, low float small cap stocks are near empty liquidity vehicles. When they are not “rigged”, they trade insanely low daily volume with near random swings in price. They have little-to-no participation and their order books are empty - until the big volume comes in.
But the stock market is, fundamentally, very simple. First, there is the order book, which represents all of the bids and asks for a particular stock’s current market. And then there is the tape, the actual orders being executed. In order for the stock price to go up, you must buy through the asks; and for it to go down, you must sell through the bids.
In small caps, what ultimately determines what pattern gets executed is the amount of liquidity present in that stock at that time, combined with what orders exists on the order book. And your job as a small cap trader is to analyze, in real-time, the liquidity situation of the current stock and determine what bearish and/or bullish liquidity patterns are possible at that moment in time.
And here’s the thing, market makers cannot just do whatever they want. They are bound by the laws of liquidity, which work, in many ways, very similar to the laws of physics.
For example, if last year, it rained a lot in your home town, then the next year it didn’t, does that mean the laws of physics changed? Of course not. The change is dependent on the various factors which influences how much rain you get in your area. There is no secret market maker weather man who is pulling the puppet strings, changing the weather when things get too “normal” or “common.”
Small caps are the same way. Different types of stocks have different types of order books, and therefore price action. Penny stocks move in certain ways, $2-5 move in certain ways, $5-10+ move in certain ways, etc. Their order books limit what MMs can potentially do.
Btw, Chinese small cap order books are notoriously empty. And in periods of high liquidity, they will abuse this fact to gap up a stock a huge %, often on relatively little buying power, get shorts interested in it, then squeeze higher through and even emptier order book as the price increases.
Recent stocks like TDIC and INHD do not break the laws of liquidity. They are abusing how much liquidity is in the system + that specific stock, and taking advantage of an empty order book to break people’s expectations (the same expectations your data graciously points you towards) to squeeze higher.
However, there is good news. In order to push a stock up, say 500%, or 1000%, or whatever big number you can think of, you must accumulate first. And thanks to the laws of liquidity, there are only so many ways you can accumulate a stock. Because in order to push a stock up 1000%, you must accumulate a smaller % of that first. And even though there is a lot of variance in how this is done, it is not random.
Which means by studying accumulation patterns, there are times where you can be very bullish a stock up multiple hundreds of %. And times where you will be very bearish. It’s not what the gapping % is, it’s HOW it gets there.
To truly understand liquidity, you must analyze HOW stocks move. And unless you are some Ph.D level math genius, I recommend NOT starting with data. There is too much risk where, regardless of how many data points you have, that you are generating an incomplete picture which will, at best, give you a tiny sliver of how liquidity actually works.
No, you must study charts. Especially across multiple time frames. The most common in small caps are the 1m, 3m, 5m, and 15m. Sometimes 30m/60m are useful on longer MDRs. And you must understand how various patterns across the different times frames work in tandem with each other. There are many times when stocks produce a “bearish” pattern on the 1m chart, only to simultaneously produce a “bullish” pattern on the 3m or 5m.
There is an ebb and flow to liquidity. A delicate dance which the market maker must maintain. Your job is to analyze the situation and figure out what is possible based on what you know about that ticker at that point in time. A combination of technical factors such as common “algo tricks” on different time frames, along with other various important factors to know (float, price point, any catalysts/theme, overall “conditions” of the market that day).
Btw I will talk about market conditions sometime later. It’s a quite complex topic that deserves to be talked about piece by piece.
Anyway, I think I rambled long enough. I truly believe edge in small caps comes from understanding how liquidity works. When I look at charts from when I started in 2019, and then every year until today, I see the exact same shit. The only thing that really changes is the amount of liquidity present in that stock at that moment in time. Everything else is the same. MMs are bound by what they can do, I would suggest studying it.
🚨 NEW ETF LAUNCHING
Roundhill and T-REX have filed to launch:
Roundhill T-REX 2X Long DRAM Daily Target ETF $RAM
The fund seeks 2x daily exposure to the Roundhill Memory ETF $DRAM
Effective June 24, 2026. Listed on Cboe.
One of the biggest downsides of chop not discussed enough is the after math opportunity cost missed.
You are sick of taking losses so you hesitate when you shouldn’t and then find yourself locked out wanting to FOMO bc you over traded the chop/basing.
The cycle repeats over and over.
"Feel" is so important... You can look at Float/Short Float til you are blue in the face
But many times MM's (I'm not talking your PDT Trader) is hunting available shares. Aka: When you buy 10K or even 1K Shares how does it move on that? What does the stock do? How does the spread look?
I think it's interesting to see people get upset with trading without doing the proper work to figure it out. How can Execution Algo's soak enough shares to lock tradable float and trigger a move.... How can discord rooms jam a name and trigger a 500% move each day... How How How > It's all in the game my friends
Perfect Example is looking at recent winners:
- CCHH or PAVS or INHD or CPOP or DSY or CIIT or heck so many more
Now remember. If you aren't in the game you likely have no edge so please take that with a grain of salt. Most of the time someone needs to pull the strings
Massive Volume into a Huge Wick > Quiet Accumulation is happening on the move lower > Next day Float Locked and low liquidity = Jam City and you see those monster squeezes... The same can happen on 1st movers but many times you need the jam to happen. Certain names can easily trigger fast and not look back, that is the tape we have but remember that shares to trade make it rise quick but lack of liquidity can create the wicked candles you see on the downside. Super Float names are a double edged sword if you aren't able to create the liquidity needed to exit (Several rooms are very good at this & certain traders even better)!
Not saying you wake up and find the next 200-500% mover but she just might whisper...
Introducing Claude Fable 5: a Mythos-class model that we’ve made safe for general use.
Its capabilities exceed those of any model we’ve ever made generally available.
In American slang we often refer to money as “benjamins” this is a subtle reference to Benjamin Netanyahu, an American folk figure who takes all of our money
Today, we remember a legend.
On this day in history, Harambe would have celebrated another birthday. An icon that became part of internet history, American culture, and an entire generation’s timeline.
Tomorrow marks 10 years since we lost him. Ten years since the moment the world stopped scrolling and collectively mourned something bigger than a meme.
He became a symbol of loyalty, strength, chaos, unity, and the strange beauty of the internet bringing millions of people together for one cause: never forgetting Harambe.
Everyone remembers where they were when they heard the news. And somehow, a decade later, his legacy still lives on.
Gone, but never forgotten.
Rest easy to a true patriot. 🕊️🇺🇸
May 27, 1999 — May 28, 2016
Forever in our hearts.
This is it.
Everything learned spending millions on longevity.
From: Your Immortal Unc and Auntie.
To: Our Immortal nieces and nephews.
0. Sleep is the world's most powerful drug.
1. Be in your bed for 8 hours
2. Same bedtime every night, any time before midnight
3. Don’t eat right before bed
4. Calm foods for dinner
5. No screens 1 hour before bed
6. Avoid added sugar (be aware it’s in everything)
7. Avoid all things in an American convenience store
8. Avoid fried foods
9. Shoes off at the door
10. Eat whole foods, particularly veggies fruits nuts legumes berries
11. Walk a little after meals or air squats
12. Get your heart rate high routinely
13. Lift heavy things
14. Stretch daily
15. Water pik, floss, brush, tongue scrape, morning and night
16. Make an effort to drink water
17. Get sunlight when you wake up (UV is low)
18. Protect skin in midday sun
19. Stand up straight
20. See at least one friend once a week
21. Avoid plastic where you can (in all things)
22. Circulate air in rooms
23. When stressed, breathe, learn to calm your body
24. Go to the dentist
25. Avoid sitting for long times
26. Protect your hearing, the world is too loud
27. Alcohol is bad for you
28. Finish coffee before noon
29. Avoid bright lights after sunset
30. If obese, look into a GLP
31. Sleep in a cold room
32. Texting while driving is dangerous
33. Turn off all notifications
34. Limit social media use
35. Don’t smoke anything
36. If you struggle to sleep, read a physical book before bed
37. 1 hour before bed have a calm wind down routine: bath, read, light walk, listen to music
38. The body is a clock and loves routine. Have a daily morning and evening schedule.
39. Avoid long distance travel where you can
40. Baby steps first: incorporate new things slowly
41. Do less… most things don’t work.
Bonus points if you get your blood checked.
Start here, it will change your life.
Trap reading (is it gonna be bull or bear trap) for #smallcaps#trading. Based on my prior posts this week and why observing micro-clearouts in structure is key. It makes some % difference in read quality on stocks. Been deploying this method for years.
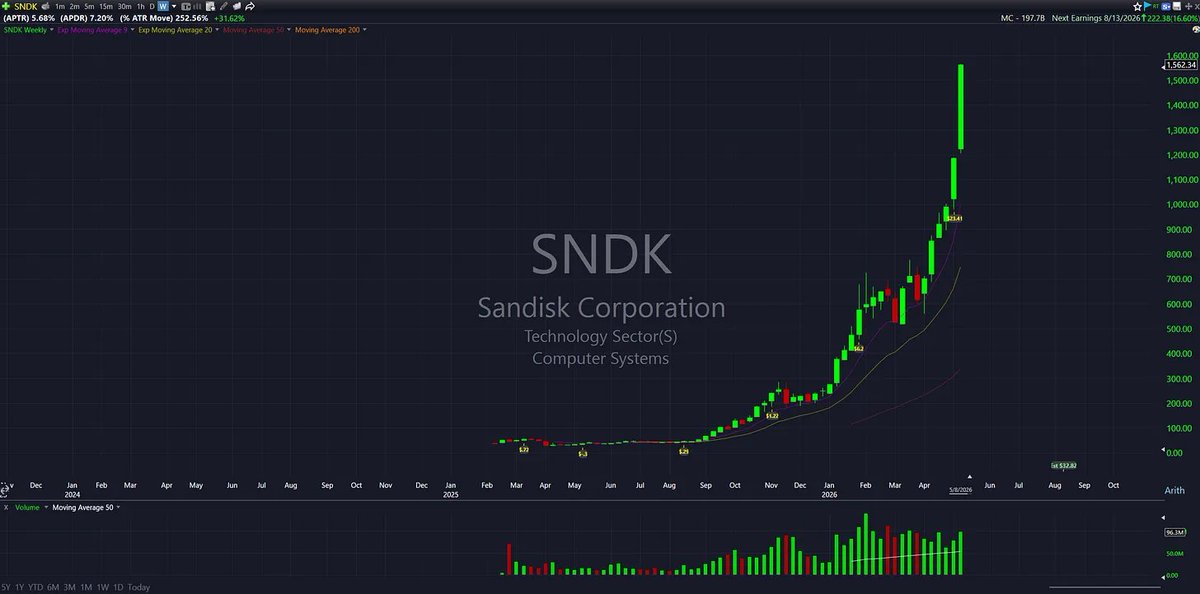
The window of opportunity is open this week for parabolic reversals in $SNDK $MU and solana:JCEmtMhYCuijq6t3bXbZeyr4566RYmsLaSdr6pYd79Rt
Let's see if this post is more hated than the parabolic short write-up I did on Silver in late January....
Jokes aside, I wanted to share my thoughts as I have during parabolic moves over the years with stuff like $SMCI $NVDA $MSTR $SLV $GLD $KORU $CAR etc, especially if I can help someone who is riding a large unrealized gain take advantage and trim into these parabolic extensions.
Early last week, I shared a screenshot of a spreadsheet I had saved from a study I did on the specific extension metrics in which many historic parabolic moves peaked. I also noted that it was too early to short the semiconductors as that they had not filled out the criteria required for a parabolic short.
Below is the same spreadsheet, but included is $SNDK $MU and solana:JCEmtMhYCuijq6t3bXbZeyr4566RYmsLaSdr6pYd79Rt updated with their extensions as of Friday's close. The green highlighted boxes represent above the average in which all the study examples peaked at.
As you can see they are not all quite above average yet, but any continued hype and momentum early this week and all three of these names will very likely be in play.
One characteristic that is extremely important when identifying a parabolic advance is consecutive weeks of range expansion. We recently saw this with Silver in January when it put together 3 consecutive weeks of range expansion before it's climax, as well as many more classic, model book examples throughout the years.
Consecutive weeks of range expansion signal exponential price progression, a hallmark of parabolic curves. It is a week by week build up into a climactic reversal. The cherry on top is a signifigant range expansion week on the 3rd or 4th week of the burst, which is typically the final week of the move.
Here are the last 3-4 weeks of percentage gains for these names:
$SNDK
Week 1 (+7.48%)
Week 2 (+19.91%)
Week 3 (+31.62%)
$MU
Week 1 (+8.20%)
Week 2 (+9.15%)
Week 3 (+9.16%)
Week 4 (+37.73%)
solana:JCEmtMhYCuijq6t3bXbZeyr4566RYmsLaSdr6pYd79Rt
Week 1 (+9.81%)
Week 2 (+20.50%)
Week 3 (+20.69%)
Week 4 (+25.40%)
Textbook parabolic price progression over consecutive weeks on all three of them.
After that final 3rd or 4th week of signifigant range expansion, you then look for a similar parabolic burst on the daily timeframe. $SNDK $MU and solana:JCEmtMhYCuijq6t3bXbZeyr4566RYmsLaSdr6pYd79Rt all closed down on Thursday, before exploding higher on Friday. Need at least 1-2 more large, consecutive days higher for these to trigger a climactic reversal.
We also witnessed what felt like complete upside panic and FOMO in the leading semiconductors on Friday. One example being the news that hit at 1pm stating that Apple and Intel reached a preliminary chip-making agreement, which led to a near +13% gain in just 20 minutes...
Moments after that headline, Trump said "Go and buy a Dell", which sent $DELL soaring an entire 200% ATR move in just 30 minutes.
This is typically the type of price action and hype you see during the final stage of a parabolic burst. Not to mention the absurd volume of options being traded on these names as we approach May OPEX this Friday...
To close this out, we also have the $QQQ at 9.91 ATR multiples above the 50-day moving average as of Fridays close, a level of extension never before seen since its inception in March of 1999. I have no doubt this market can continue higher this year, but this print only helps add conviction to the names potentially setting up for a opportunity into this week.
To clarify, the parabolic short is an extraordinarily high-probability mean reversion opportunity, that can sometimes lead to secular tops, but not always. I have no clue where these stocks will be a month or a year from now, but I know my setups when I see them.
As an example of someone that did it right:
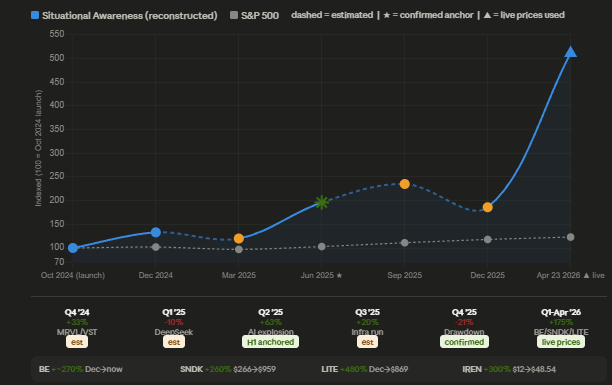
Leopold Aschenbrenner
The backwind was fully accessed and seen (link to view expressed in June 2024.
The idea was simply that AI (especially the path to AGI/superintelligence) will drive trillions in capex on compute clusters, power, data centers, and chips. The fund aims to be "more situationally aware" than Wall Street on AI timelines and bottleneck.
He published a thesis in 2024 that most dismissed as hyperbole, then built concentrated positions while Wall Street was distracted by short-termism.
Much has been misstated about him linked to AUM growth via further growth of LP investments so I tried to normalize his performance via his assets as if he invested personally. Model below.
Overall the lesson is two-fold, the first is of course the mental model as described in the post above but the second is that the bigger secular trends take time to shape and 80%+ of the majority of gains happen within the last 2/5 as the bubble expands and reaches parabolic status.
Leopold was over a year late to the AI supertrend when he released the paper. The $NVDA AI earnings gap up had happened in June 2024, a full year before the release of the paper and another 300% higher than a year ago.
Bubbles take 5y+ to fully rippen. To a large extend sitting out the first 1-2y can actually be great to pinpoint the magnitude of the catalyst and trend nature, but 99/100 humans focus on short-termism, looking back and thinking its too late instead.
So in short to finish my point:
-It takes half a decade to develop a tech bubble
-It takes 1-3y of easing to come off of a major economical hit
-It takes the hyperbole in sentiment/news and the trend in acceleration to shift to negative to find a turn, while it is the realization of good news eventually that fully prices the then made move and often ends it.
->The market makes a move and explains later, it doesn't explain first.
-The best timing instrument is positioning and acceleration of news/negative catalyst aspect.
-Bad news is a real feature of functional markets, they are the norm, not the exception and they create long term opportunities. Do not fight it.
-Markets price in years of cash flows which grow themselves and make short term earnings even less important.
->Understand a short term catalyst or even mid term does not change much about 10y+ of cash flow and growth.
-Listing the frequency of pullbacks helps to see what markets actually are and how resillient they are.
pullback frequency per year:
5%: ~3x per year
10%: ~1x per year
15%: ~1x per 2 years
20%: ~1x per 3.5 years
30%: ~1x per 12 years
40%: ~1x per 20 years
Thinking within this framework will allow for an easy checklist to work through and a good quarterly and yearly review for overall approach.
https://t.co/O19UKlHiqU or https://t.co/kyV0EKpaKn