Google has announced that it is suspending the rollout of its AI image generation feature in Google Earth after major backlash from experts on potential abuse.
So it seems Google activated its AI image generation program inside its satellite image app today (blog post here: https://t.co/z7JlLrNuB8). Very curious how or if this idea was red teamed internally because the opportunities for abuse and disinfo are literally boundless.
GTA V was built to let you cause chaos, now it's being used to train FPV drone pilots.
It's not a replacement for real flying, but it's cheaper and safer than crashing $1,000 drones while learning.
PS. Follow us @themetav3rse for latest news on emerging technology and internet culture.
Shijian-31: a satellite with an orbit we have never seen before
China launched Shijian-31 on June 16 from Xichang, officially described as a "space environment detection" mission. The orbital elements suggest more going on.
The inclination 63.46° sits at the value where perigee advance goes to zero. Anyone who's tracked Molniya-class satellites will recognize that immediately.
But the resemblance stops there. A classic Molniya parks its apogee over high northern latitudes and dwells for hours, that's the whole design premise. SJ-31's argument of perigee is 171°, which puts perigee near the equator and its apogee on the opposite side. (Image 1: SJ-31 at 171° argument of perigee vs. a generic Molniya at 270° argument of perigee.)
So the long dwell isn't over any particular latitude — it's over altitude. Apogee reaches ~39,900 km, about 4,100 km above the operational GEO belt where comms and missile-warning satellites sit. Nearly a third of each 12.5-hour orbit is spent above that shell, crossing it twice per pass at a steep 63° angle. (Video 1: SJ-31's orbit visualized with example GEO assets.)
It's also not fixed on one region. The period is just off a clean repeating ground track, so the sub-apogee point slowly drifts around the globe — sweeping past every longitude roughly once every 24 days.
Net effect: an orbit that periodically looks down on the entire GEO belt from above, at an angle, on a rotating schedule, rather than fixating on one target.
What's it actually doing up there?
@SpaceNews_Inc@BreakingDefense@joroulette@shell_jim@planet4589@IntegrityISR
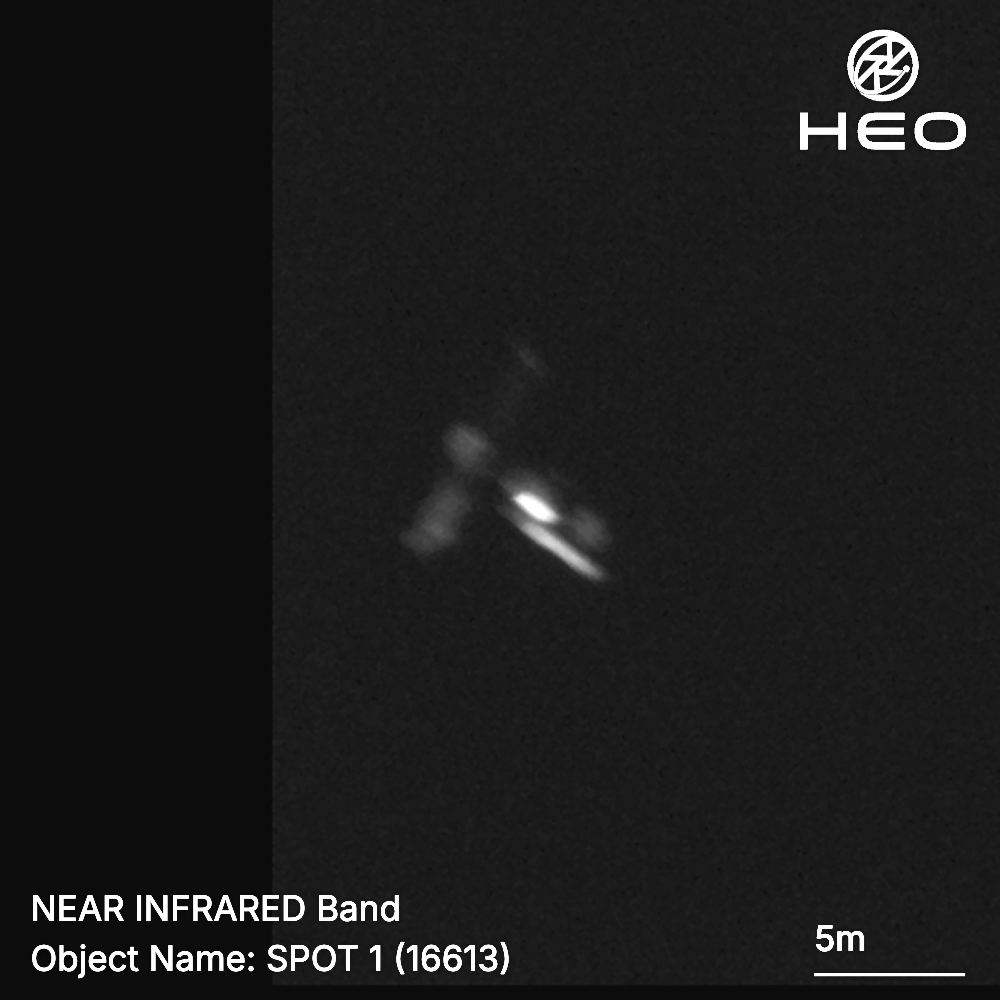
In 1986, this satellite provided the highest-resolution civilian view of the Chernobyl exclusion zone available at the time, captured within days of the disaster.
SPOT 1, launched by CNES two months earlier, gave analysts imagery to begin understanding the scale of what had happened, at a moment when a 30 kilometre radius around the plant had been evacuated, 115,000 people displaced, and the ground itself too contaminated to survey on foot.
SPOT 1 was one of the most capable Earth observation satellites of its time, delivering a sharp 10-meter ground resolution in panchromatic mode and 20 meters in multispectral mode. Its two-pass stereoscopic correlation technique produced usable elevation data for large portions of the planet's landmass, a capability that proved essential for reading terrain in a landscape where ground access was not an option.
The story did not end with the disaster. In 1988, SPOT 1's near-infrared sensor captured some of the earliest evidence of recovery, photosynthetic activity returning to the exclusion zone. The SPOT series kept observing the area for years afterward, tracking decontamination work, new construction and reforestation as the region slowly changed.
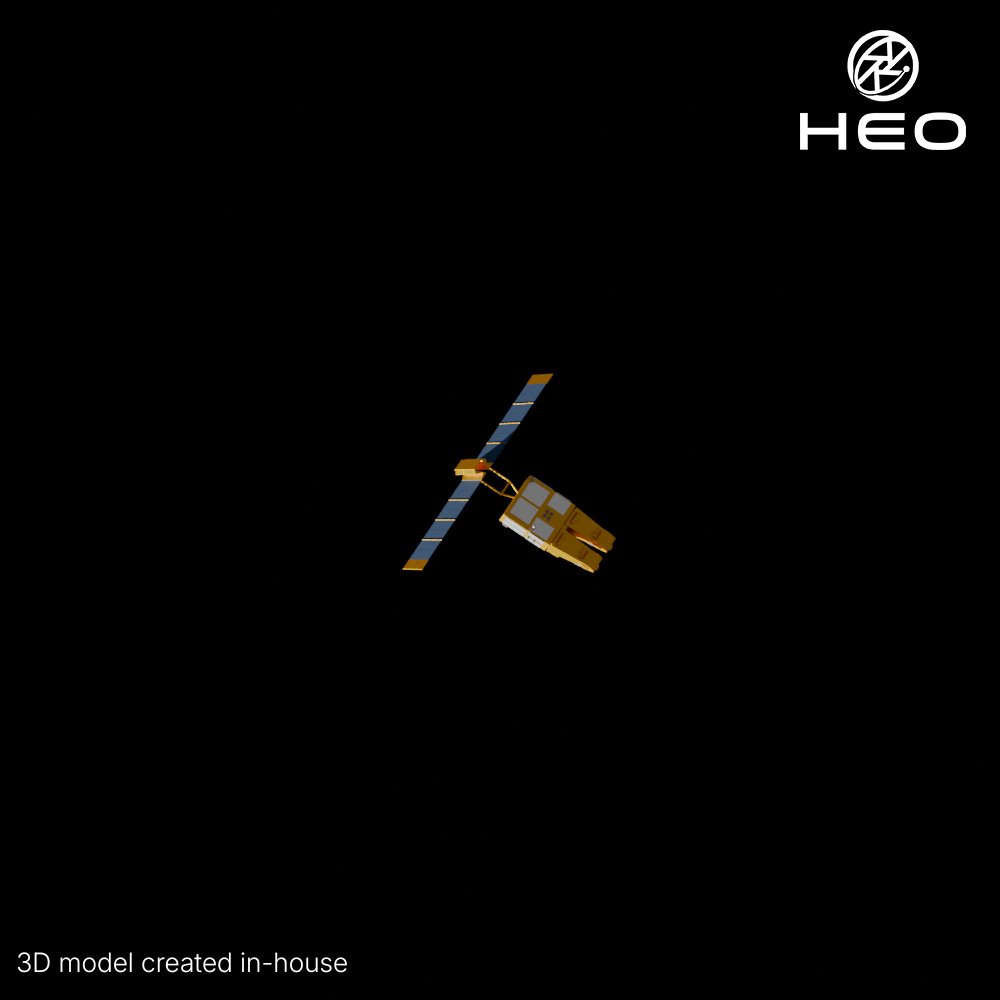
Nearly 40 years after launch, HEO imaged SPOT 1 in orbit, checking in on the state of the asset. The solar panels remain fully deployed and the satellite appears largely intact. Beyond physical condition, the imagery also offers a read on the object's behaviour, whether it is tumbling, stable, or holding a fixed orientation, information that is critical for space domain awareness on the growing population of aging, non-manoeuvrable objects in orbit.
Antelope Reef has reached another construction milestone with the completion of a new 680-meter quay, this enhances its waterfront infrastructure as the reclaimed feature steadily develops into China's largest artificial island in the South China Sea
My conversion of the RBT style from @ArmyGeospatial to @protomaps was missing power infrastructure, but I managed to create my own planetiler profile that extracts the missing data and creates a more complete look.
Then we can create a single mapbundle file with all resources.
AP's Juan Arraez was in Venezuela when a devastating double earthquake ravaged the country on Wednesday. Today, he captured footage of citizens digging through the rubble of their homes, saying they have seen few state rescue teams in the areas hit hardest by the devastating 7.2 and 7.5 magnitude quakes.
AP Video/Juan Arraez
Satellite imagery of Venezuela shows a birds eye view of the damage caused by back-to-back earthquakes that rocked the country on Wednesday. Officials said Friday that at least 920 people had been killed by the earthquake, while more than 50,000 people remained unaccounted for. For the latest, click the link below.https://t.co/FKuM6JATOA
GeoLibre v1.5.0 is here!
GeoLibre is a free and open-source, lightweight, cloud-native GIS platform for visualizing, exploring, and analyzing geospatial data. It runs everywhere you do, in the web browser, on the desktop, on mobile, and inside Jupyter notebooks, all while keeping your data local and private.
This release lands 90+ merged pull requests and resolves 90+ issues, adding a dashboard of chart widgets, customizable UI profiles, a saved library of web services, and an in-browser Whitebox raster engine.
What's new in v1.5.0
- Dashboard panel: Build a collapsible panel of chart widgets (histogram, scatter, bar, line, box) next to the map.
- Customizable UI profiles: Tailor the menus and filter the data sources you see, so the workspace matches your workflow.
- Saved service library: Save and reuse your favorite web-service layers (XYZ, WMS, WFS) instead of re-entering URLs.
- Whitebox in the browser: Run Whitebox raster tools fully client-side through a WASM runtime, no Python sidecar required.
- View menu and viewport history: Step backward and forward through your recent map views from a new View menu.
- A more beautiful globe: Add a spinning globe, customize the atmosphere halo and deep-space colors, and reset pitch and bearing with a rotation indicator.
- More basemaps: New Protomaps basemaps and support for stacking multiple raster basemaps.
Try it out
- Live demo: https://t.co/hOVekblXMc
- GitHub: https://t.co/VXq8c1o2Nd
- Documentation: https://t.co/7VA2AQoCUc
- Release notes: https://t.co/VhWQ4eUw3T
#GIS #GeospatialData #OpenSource #RemoteSensing #DataVisualization #MapLibre #Python
New satellite imagery shows recent developments at suspected Chinese-linked intelligence facilities in Cuba. The array of 32 antennas is larger and likely more capable than any Cuban circularly disposed antenna array (CDAA) previously observed by CSIS.
Learn more: https://t.co/gNqlXLCHVM
One of the largest AI infrastructure builds is rising, and its progress can be followed from above. SkyFi's multi-provider network combined satellite imagery from Vantor, Planet, and Satellogic with Vexcel aerial as fine as 7.5 cm to track the Stargate campus in Abilene as it grew from open ground into a large-scale complex.
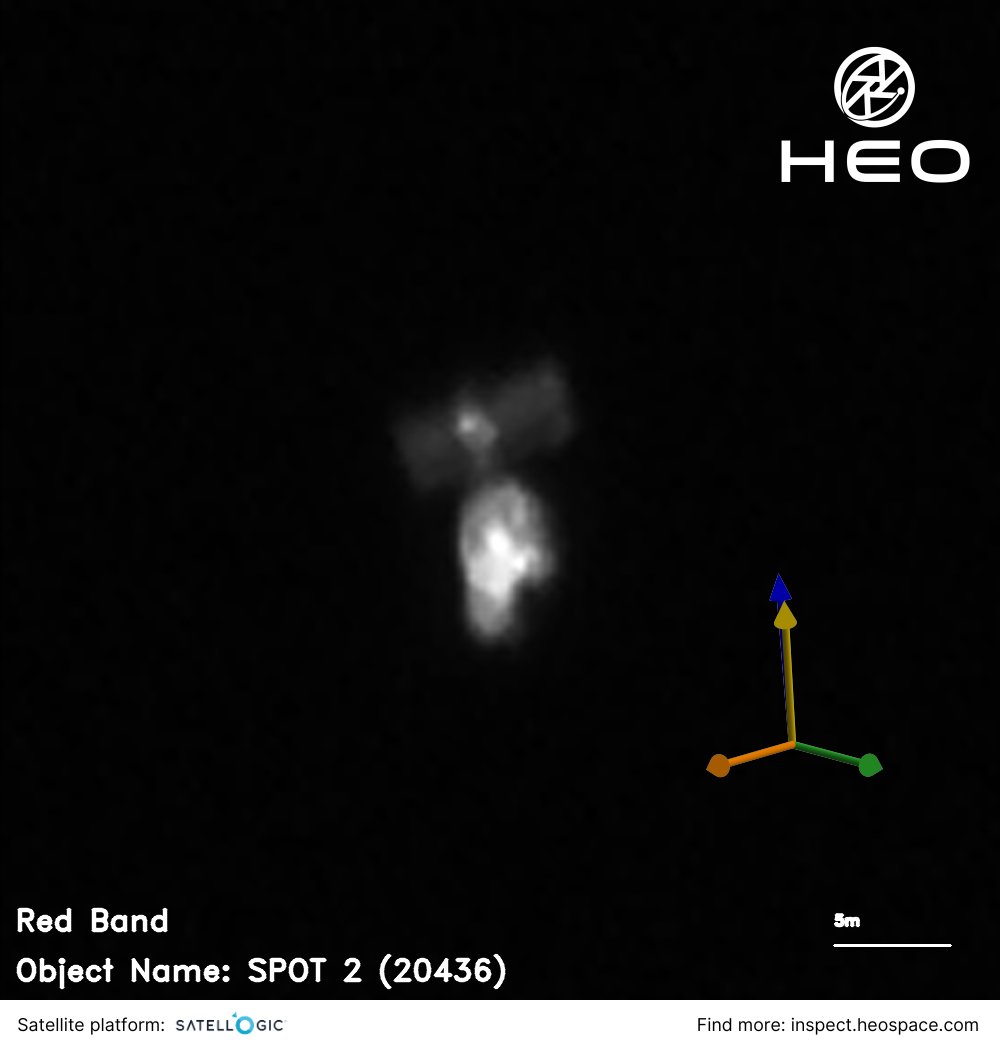
A satellite from before the first website existed.
SPOT 2 launched in January 1990 as the second satellite in CNES's SPOT series, France's pioneering civil Earth-observation programme. It carried two High Resolution Visible imagers and introduced steerable mirrors that let it look to either side of its ground track, a real advance over the nadir-only systems of the era. When CNES ended the mission in 2009, it lowered the orbit so the satellite would reenter on a shorter timeline.
HEO characterised the object at 22 cm/px from roughly 147 km away as it passed off the coast of Russia. Non-Earth Imaging, where one space object images another, is how a satellite designed to look down at Earth can itself be inspected in orbit decades after its mission ended, and long after the people who operated it stopped communicating with it.
Tactical ISR moves at the speed of decisions. ICEYE ATR processes a Dwell Fine image in seconds: bombers, transport aircraft, helicopters, air defense. Classified output, not raw data.
https://t.co/GiW1RAV9pR
@maplibre's most recent newsletter dropped last week: Martin tile server now serves MLT on the fly (39% smaller), GL JS v6 pre-releases are open for testing, and the team is at State of the Map US in Madison this week.
#MapLibre
https://t.co/bjz3Xptt0I