These are the rare "interstate-induced clouds" that formed over Houston's highways on Tuesday morning, wowing meteorologists.
As roads warmed faster than the surrounding land after sunrise, very humid air above them rose, cooled and quickly condensed into rows of cumulus clouds.
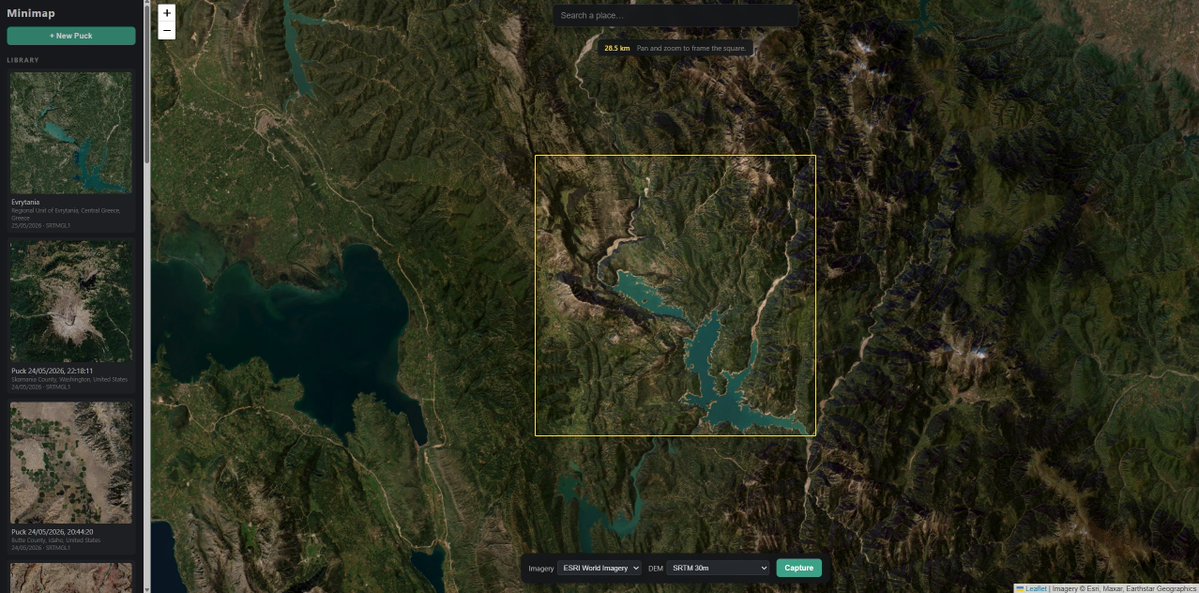
I've been posting a few minimaps or "pucks" after making them with an app I built using Claude, Three.js, Google, ESRI and OpenTopography.
Very straightforward: scroll around the world map or search for a location, pick an area of interest, line it up in the frame and hit capture. Then just make some adjustments and export an image, orbiting video or an .stl.
Just another cool way to explore and share the world. Hope to make it live after improving the experience.
Regional Unit of Evrytania, Central Greece, Greece 39.00123°N, 21.46591°E
#minimaps #threejs #googlemaps #Esri #OpenTopography #OSM
Some of these pumice rafts in the #Bismarck Sea from the Titan Ridge Volcano, are massive. A rough outline of this one captured by Sentinel-2 this morning gives it at 69 square km. That is an area of floating rocks larger than Manhattan Island. #TitanVolcano
Twice a year in Hawaii, the sun passes directly overhead, causing objects to cast no shadows at all.
This striking phenomenon is known as Lahaina Noon.
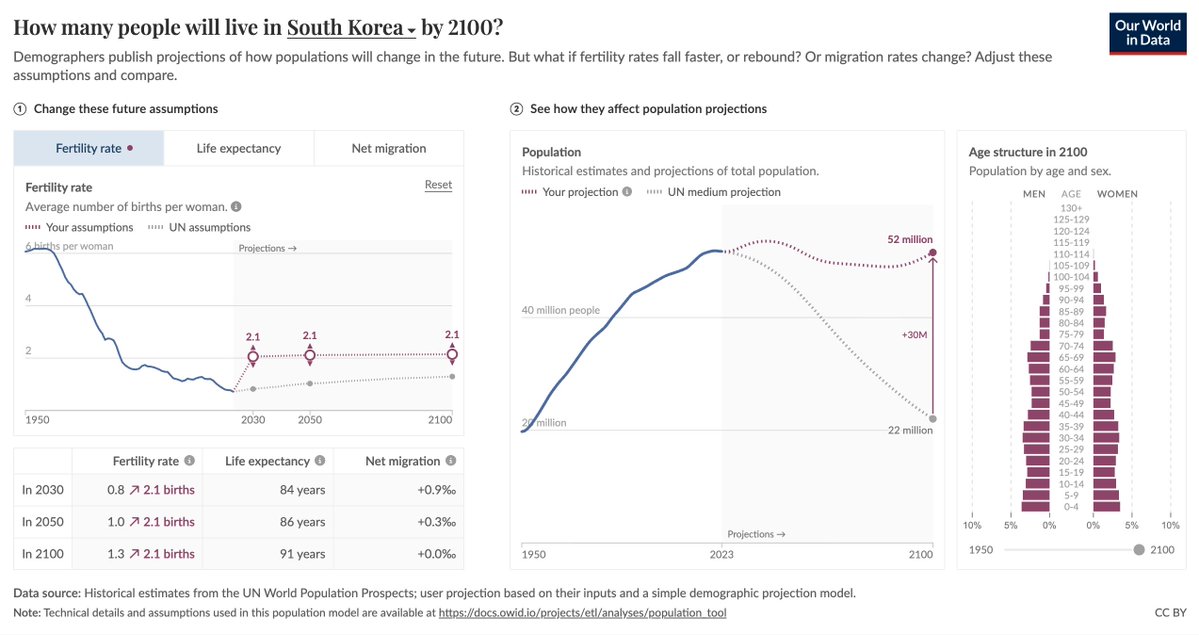
How will populations across the world change in the 21st century?
🔧 Explore for yourself with our new interactive tool!
Demographers publish projections using assumptions about key demographic changes, most notably fertility rates, life expectancy, and migration rates.
But no one knows for sure how many children people will have decades from now, or how migration will shift.
So it’s worth asking what the population would look like if things turn out differently from what the UN or other demographers assume.
Our colleagues Daniel Bachler and Sophia Mersmann built a population simulation tool that lets you do just that — for every country in the world.
Pick a country, adjust the assumptions, and see how the projections change, for both total population and age structure.
For instance, what would happen if fertility rates recovered to replacement level, or migration was cut in half?
Intense heat from this large wildfire in Broward County, Florida is rising so rapidly that it’s cooling and condensing onto smoke particles, creating these towering pyrocumulus clouds. ☁️🔥Ash was even found on cars in Pembroke Pines. More than 11,000 acres burned so far. #FLwx
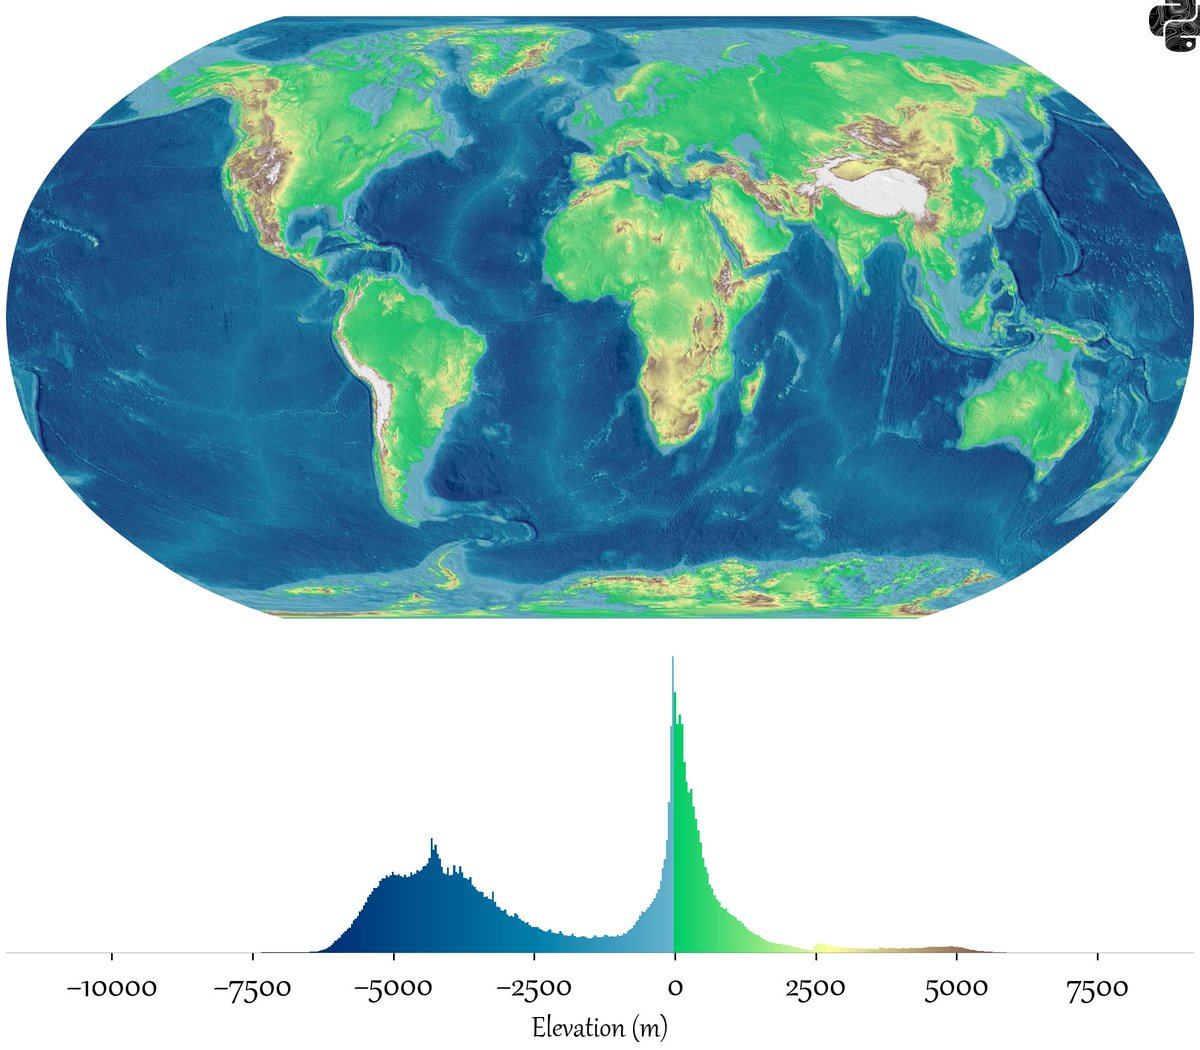
Transparent Globe Project- It’s finally complete!
10 unique interactive 3D globes, each visualizing a completely different global dataset in real time.
From river flows and seismic activity to population density, global inequality, satellite constellations, and even Sonic Nomad roaming the planet with live music.
Every globe is transparent, responsive, and built from scratch to feel alive.
#CreativeCoding @threejs@reactthreefiber #DataVisualization #WebGL #GenerativeArt #BuildInPublic
These are the sharpest images of the solar corona to date.
To create these images, a team of scientists from the New Jersey Institute of Technology developed a new "coronal adaptive optics" system that eliminates image blur caused by Earth's atmosphere.
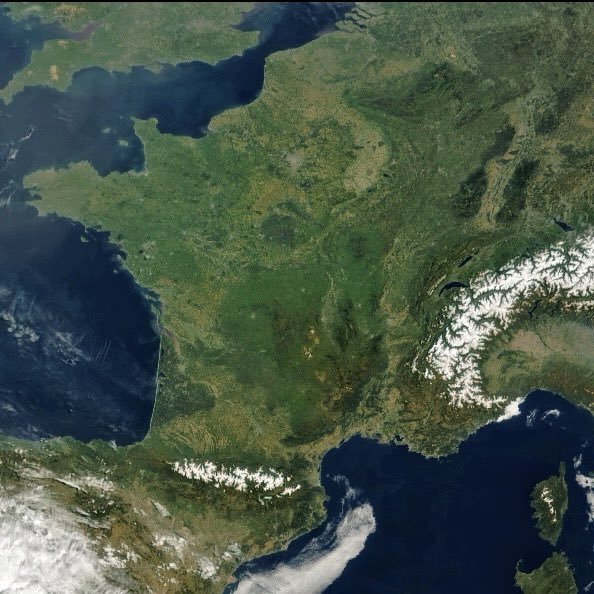
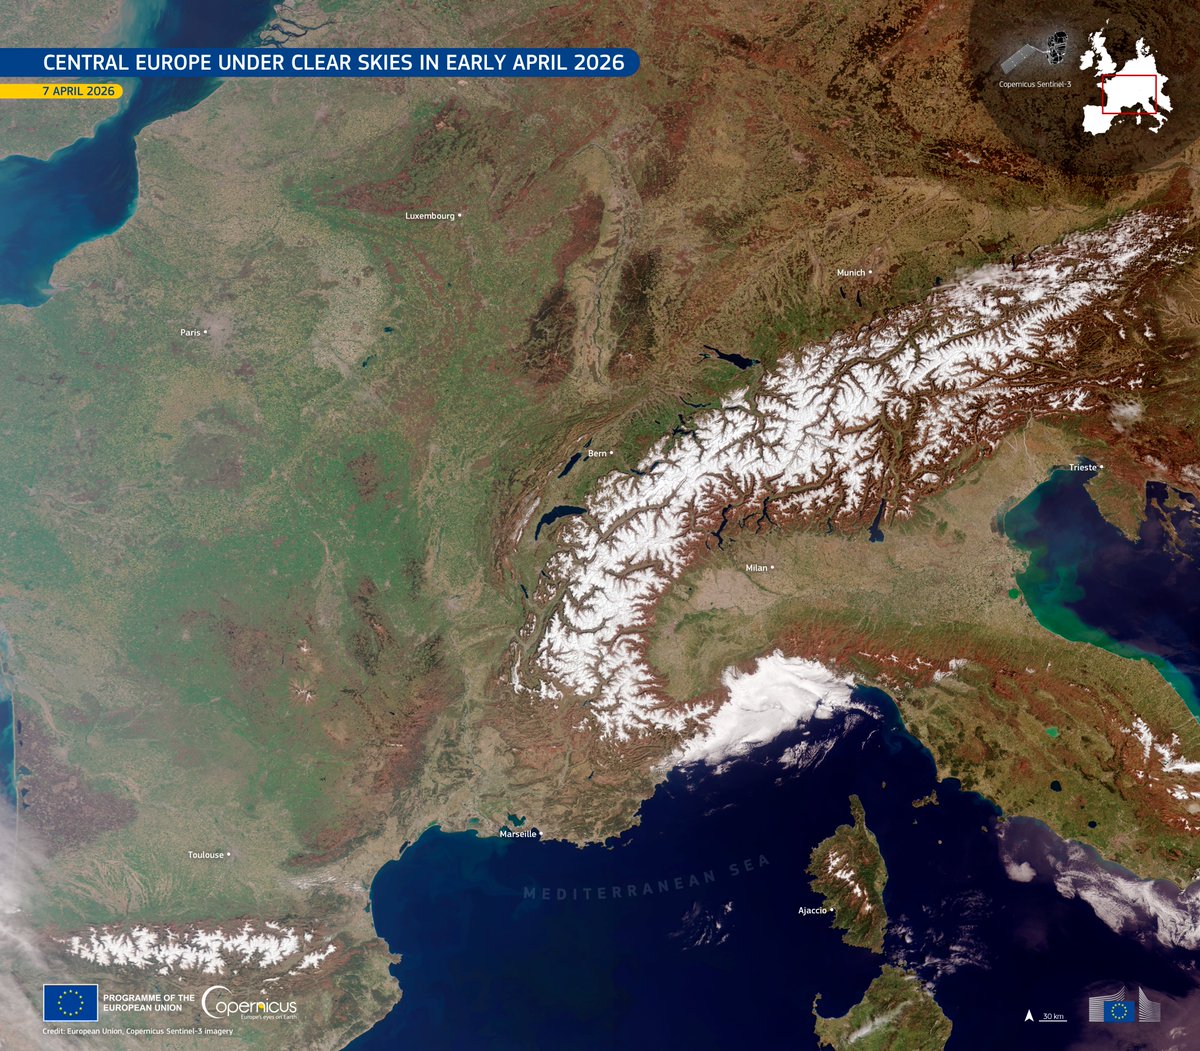
🌤️ After weeks of rain, Central Europe saw clear skies on 7 Apr.
🛰️ #CopernicusEU Sentinel-3 captures the seasonal shift: snow-covered Alps, green lowlands, hazy Po Valley & dark blue lakes.
🔗 https://t.co/GGuGrL82KE
#ImageOfTheDay