Gold looks right on track to start its 4 - 5 year bear market according to the 10/4 Cycles Theory.
It had a perfect 10.5-year bull market with a parabolic top in January of this year.
Gold and other precious metals are set up to start recovering just before the predicted recession period of the Quartcent Cycles Theory (2034 - 2041).
For now, precious metals should take a back seat. But in 5 years from now... it could be a good pivot during the 10 year market pause.
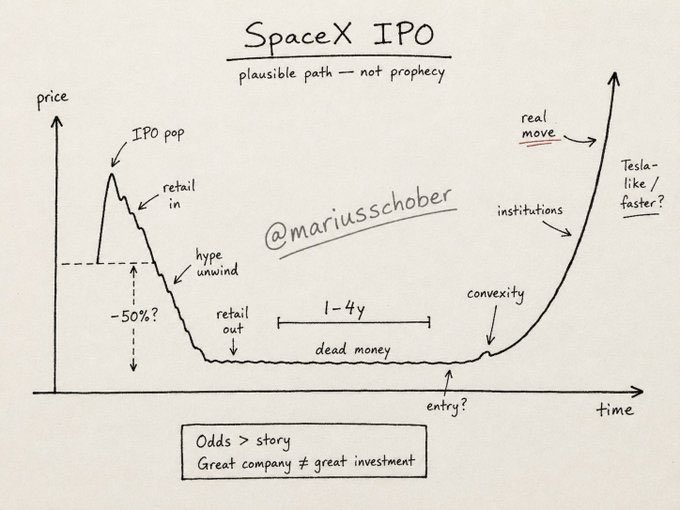
Here's the problem with SPCX, and no analysis can solve it.
There is no chart.
We have three rules for every IPO:
– Never buy on day one
– Wait for the "Good Chart" to form, enough price history to read trend, support, and the real level
– Ask whether you'd buy at this price if it were already listed
So look at how these stories usually trade. A pop as retail piles in. A long grinding melt as expectations meet reality, often down 50% or more. Then dead money, one to four years of nothing while the company grows into its valuation. And only then, the real move.
Amazon fell almost 90% after listing before it became Amazon. The class of 2021 was brutal: Robinhood -92%, Coinbase -92%, Rivian -95%, Oatly -97% from their day-one highs.
A great business and a great investment are not the same thing. The price you pay decides which one you get.
SpaceX may well be the most important company of the next fifty years.
Which is exactly why there's no rush to overpay on the first afternoon.
The rocket launches today.
The Good Chart launches later.
We'll wait for it.
Full breakdown in this week's Weekly by arvy.
Link via bio.
$QQQ Monthly Wave Count Update
The original count was published on 03/25/2023 when QQQ was trading near 312.
The first update was posted on 09/19/2024 when QQQ was trading near 491.
Today QQQ is trading above 700 and the larger degree 5th wave remains in progress.
This is not a trading wave count.
It is an investor map designed to identify the primary trend and the long-term path of least resistance.
Monthly wave counts are measured in years, not weeks. The objective is not to forecast the next pullback, but to track the progression of the larger secular advance as it unfolds over time.
With Q2 ending in a few weeks and the AI-driven expansion continuing across semiconductors, cloud infrastructure, and data centers, it is time to update the count and extend the 5th wave projection.
The market will continue to experience corrections, pullbacks, and periods of volatility along the way.
The larger framework remains intact.
$SPX $SPY
🚨 Yesterday I wrote that all four historic market risks – inflation, liquidity, tech, credit – are simultaneously present for the first time in 50 years.
Today let's zoom out further. Way out.
This chart shows 225 years of US stock prices, inflation-adjusted. It reveals something most modern investors have never seen, because the data simply isn't long enough in our living memory.
Roughly every 60 years, the market completes a full secular cycle:
– 1802 → 1857: 50-year rise, ended with US secession war and 5 years down
– 1857 → 1920: 63-year cycle, ended with WWI, post-war inflation and 11 years down
– 1920 → 1981: 61-year cycle, ended with oil shocks, Vietnam, stagflation and 13 years down
– 1981 → ?: the current cycle
If the pattern holds, the next secular top arrives around 2028. Followed by a 10-15 year inflation-driven drawdown that bottoms somewhere between 2039 and 2043.
The recipe is always the same
Each secular ending has three ingredients:
1. Persistent inflation
2. Geopolitical conflict (war, deglobalization, empire transition)
3. A speculative melt-up in the dominant sector of the era
The 1850s had railroads.
The 1910s had electrification and trusts.
The 1970s had the Nifty Fifty.
The 2020s have AI.
We're already two of three in 2026. Inflation has returned. Deglobalization is accelerating. The AI melt-up is the missing piece, and it's underway.
Why this matters
The playbook that worked from 1981 to today was defined by one regime: falling rates, globalization, passive flows, US tech dominance.
That regime ends with every 60-year cycle. Historically, the next decade rewards a completely different set of assets.
What worked in the cycle just ending:
– Long-duration growth
– Passive index investing
– US large-cap concentration
– Tech
What has worked through every secular transition since 1800:
– Cash-flowing businesses with pricing power
– Real assets and infrastructure
– Defensive, durable, boring
– Active stock selection
The uncomfortable part
Every cycle felt unique to the people living through it.
The 1920s investor was certain the new technologies of his age were different from the railroads of 1857.
The 1968 investor was certain stagflation couldn't happen in the modern economy.
They were all wrong in the same way.
If we're somewhere near the top of cycle four, the quality stocks being mocked today aren't dead money.
They're early.