Black communities throughout history have used maps to document, restore their sense of place, and “talk back” against their oppression. Learn more about the power of the Living Black Atlas and restorative mapping projects by @JoshGeog and @MLKStreet. #BHM https://t.co/h8zy3hhlz2
This week's #TidyTuesday takes a look at a topic I never would have guessed there would be data about - groundhogs seeing their shadow. Thanks to @nrennie35 for unknowingly providing the code for the curved arrow via her GitHub.
#R4DS#DataViz
6 months, 158,000 map training datapoints, and an entire rebuild of the AI later: today is the launch of our QGIS AI Map Tracing Plugin!
Check it out in the QGIS plugins window as "Bunting Labs AI Vectorizer" #GISChat
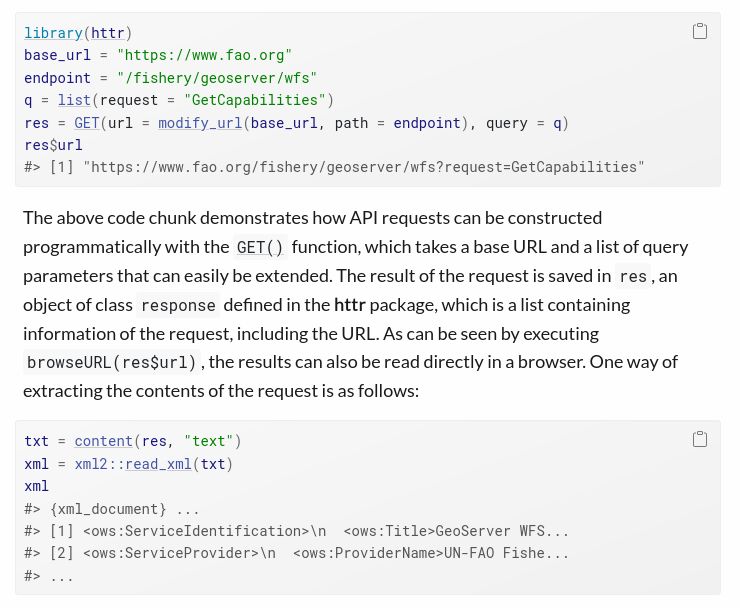
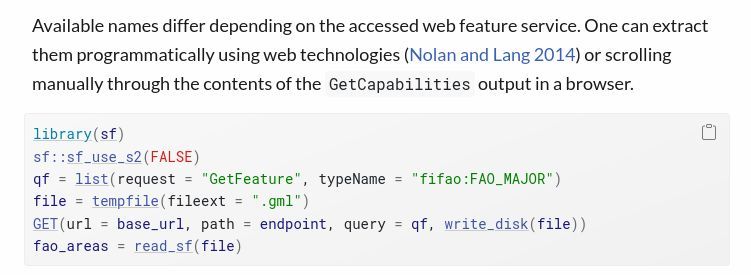
The Geocomputation with R just gained two section by Emmanuel Blondel:
1. On geographic web services: https://t.co/ZdXYGSvjlT
2. On geographic metadata: https://t.co/VayuTxAcgZ
#rstats#rspatial#geocompx
A mash up of some 3d work over the past month or so for todays #30DayMapChallenge. It's a mix of work brand stuff, personal experiments and some abstract art exploration thrown in for fun. I also updated my website with some projects from this year https://t.co/3VLG6bAec4 if you want to see more 3d map fun! #3d #map
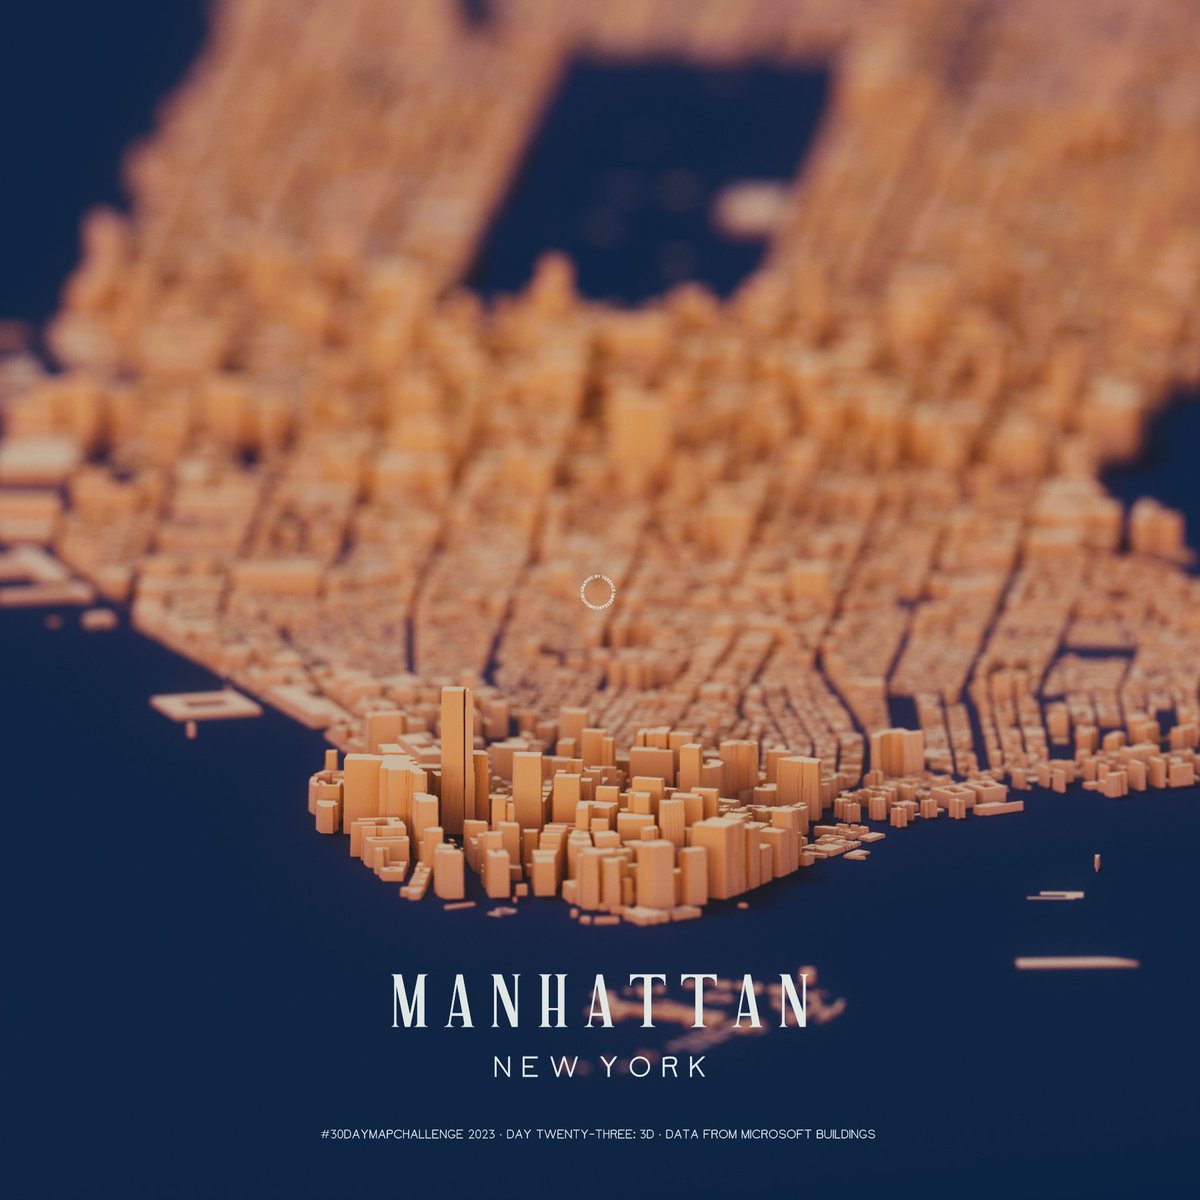
#30DayMapChallenge Day 23: 3D. Technically everything I've done so far is 3D—illuminated tubes, tiny illuminated spheres, big illuminated spheres, path traced shaded relief, 3D polygons. For unofficial #rayshader day, I decided to render the building heights of New York, New York
#TodayinHistory#datavis#Onthisday#OTD
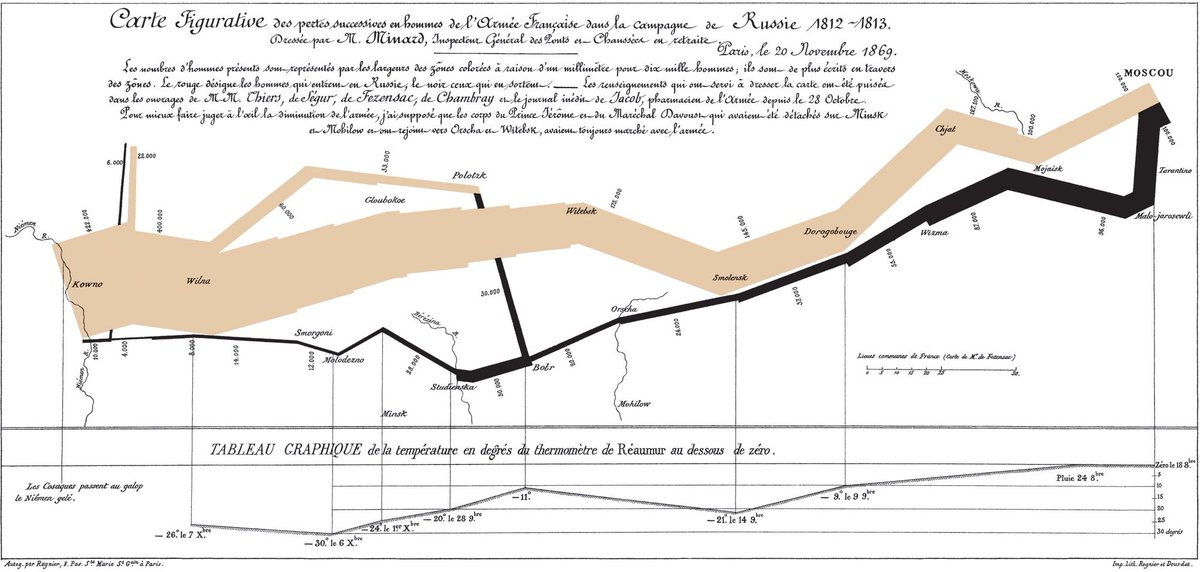
📅Nov 20, 1869 Charles Joseph Minard published his iconic flow map graphic of Napoleon's March on Moscow, some have called the best graphic ever produced.