🚨 WE ARE NOW ENTERING THE HOTTEST PHASE
Every mid-term election year for 50 years has delivered a drawdown
1974 Ford: -35%
1978 Carter: -15%
1982 Reagan: -17%
1990 Bush: -20%
1994 Clinton: -8%
1998 Clinton: -22%
2002 Bush: -34%
2010 Obama: -17%
2018 Trump: -20%
2022 Biden: -27%
2026 Trump: ???
Ten mid-term years. Ten drawdowns. Not one skipped its turn. Average: roughly -21%.
And 2026 has more than the calendar working against it. A new Fed chair, eight weeks into the job. Across nine decades, every new chair was greeted with an equity drawdown in his first three months. Twelve chairs, twelve drawdowns, average roughly -12%. The market doesn't price a person. It prices a probability distribution. And it probes until the new chair reveals himself.
The last time both cycles overlapped: 2018. Powell takes the chair, Volmageddon hits within days, and after "a long way from neutral" the market pushes the S&P down 20% into Christmas Eve. Then Powell blinked. 2019 delivered over 30%. New chair, mid-term year, autumn washout, capitulation low, melt-up. That's the template.
Even fear has a calendar. The VIX troughs in early summer and peaks in September and October, and in mid-term years the crest runs higher. It sat in the mid-teens in early July, right at the seasonal trough. On Friday it jumped above 18. The market has started paying attention. It has not yet paid the full toll.
Meanwhile the shock absorbers are gone. Retail cash allocations at extreme lows seen only in 1998, 2000, 2018 and 2021. Put/call skew at a record low, nobody is hedging. Record IPO supply draining liquidity from the existing market.
And here's the flip: every single one of those ten mid-term drawdowns was a buying opportunity. Not most. All. Since 1934, the average rally off the mid-term low: roughly 47%. The market took out its prior high four times out of five. Bull markets don't die of drawdowns. They die of exhaustion. The mid-term correction is the maintenance schedule of the four-year cycle.
The playbook is not heroic. Hold your quality. Keep dry powder with a shopping list attached, decided at VIX 18, executed at VIX 28. Buy the fear in tranches.
The full map is out tomorrow, free for everyone. Twelve Fed chairs, ten mid-terms, the VIX season, the liquidity cycle, the 1998 rhyme. And the four tripwires that would prove it all wrong.
Greed is obvious. Fear is the edge.
When the cannons fire, buy.
A Trend-Following Strategy (18% Annual Returns Since 1926)
A recent research paper, “A Century of Profitable Industry Trends,” by Carlo Zarattini and Gary Antonacci demonstrates that a straightforward trend-following approach applied to industries has produced impressive long-term results.
The system, based on breakout entries, trailing exits, and volatility-adjusted position sizing, generated approximately 18% annualized returns going back to 1926 across 48 industry portfolios, while maintaining strong risk-adjusted performance.
Trading Rules
The strategy detects trends using simple breakout techniques.
A long position is initiated whenever an industry’s closing price rises above the upper boundary of either a Donchian Channel or a Keltner Channel.
The Donchian signal uses the highest price observed during the previous 20 trading days, while the lower band relies on a longer 40-day lookback period.
This asymmetry encourages the system to remain invested during sustained advances.
The Keltner Channel is constructed around a 20-day exponential moving average combined with a volatility buffer equal to 1.4 times the Average True Range, again paired with a 40-day lower band.
The strategy only takes long positions. When no industries display clear upward momentum, capital is allocated to Treasury bills instead of remaining exposed to equities.
Risk management
Risk management is handled through volatility targeting. Each industry position is scaled so that it contributes a similar amount of risk to the overall portfolio.
Allocation weights are therefore inversely proportional to recent 14-day volatility, meaning more volatile industries receive smaller positions.
To keep leverage within realistic limits, total portfolio exposure is capped at 200%.
Exits are governed by a trailing stop mechanism. The stop level is defined as whichever is higher between the lower Donchian band and the lower Keltner band, both calculated using a 40-day lookback.
Importantly, once the stop moves higher, it is never reduced. This allows profitable trends to continue while ensuring losing trades are closed quickly.
Results (Backtest below image)
To read our full article on this strategy, check out our X-post (Feb14-26). I strongly recommend reading the original research paper for a deeper understanding.
"People with the greatest fortunes got there by riding a long term trend. My number one point is you're going to make your money by riding a trend for a very long time." — PTJ
https://t.co/S1n64Sd98i
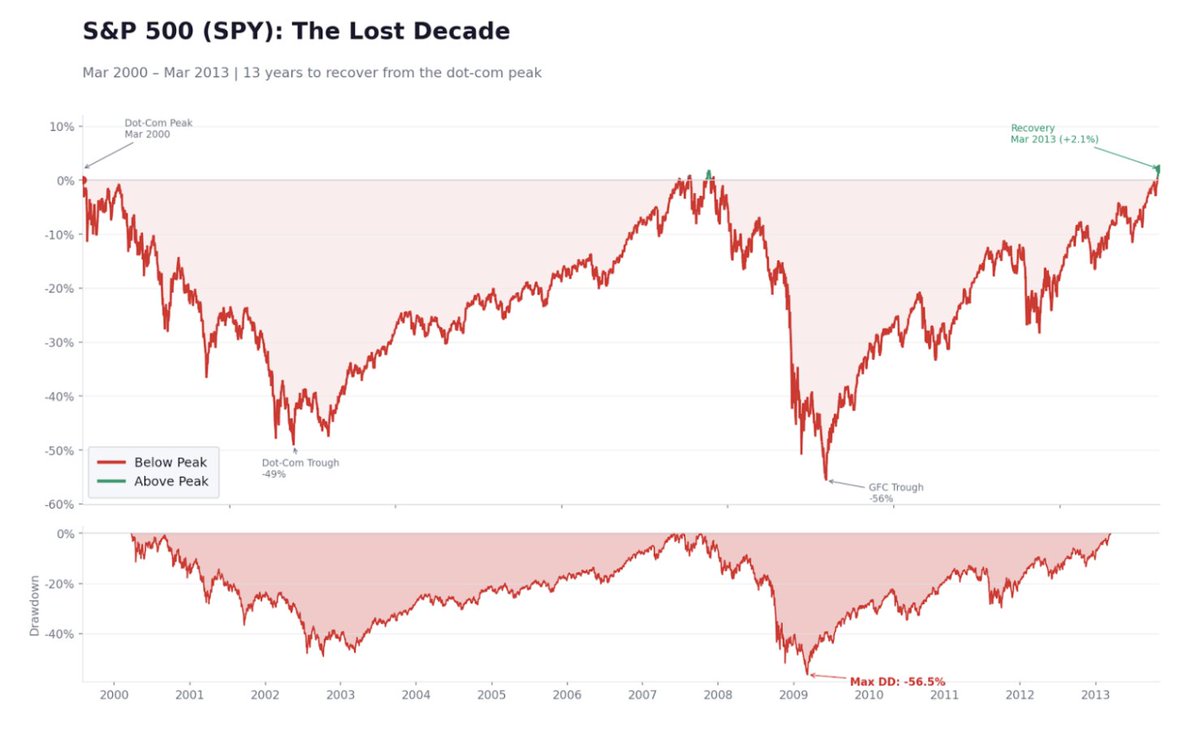
13 years.
That is how long passive S&P 500 allocators who entered at the March 2000 peak waited to see positive returns.
The S&P 500 fell 49% over 31 months and took seven years to recover.
Just when allocators thought they were in the clear, the 08' financial crisis hit immediately, causing another 57% drawdown, another five years and five months to breakeven.
That's 13 years of zero nominal returns, for a strategy marketed to long-term investors as the "gold standard".
The problem is that a market-cap-weighted index has no mechanism to reduce exposure, adapt positioning, or access independent return sources.
You have full participation in both upside and downside. Recovery entirely dependent on the duration of the next bull cycle.
At current valuations and elevated concentration in the S&P500 a major drawdown is not a question of if, but when.
The alternative is an architecture designed to do what passive exposure simply cannot, composed out of multiple uncorrelated systematic return driving strategy sleeves.
Each strategy sleeve profits from different market regimes, increasing overall compounded returns and reducing both the depth and recovery time of drawdowns.
Exposure architecture has a significant impact on long-term returns.
"If CTA Trend Following ETFs match or outperform funds going forward, the implications for allocators are profound. Why tolerate lower risk-adj returns from higher cost products? Several years ago, CTA ETFs were derided as cheap knock offs. Today, they seem like progress."
https://t.co/j4snDX3Zs0
Even with such remarkable performance, the majority of Magellan Fund investors lost money during Lynch's time at the helm. They chased performance, piling into the fund after strong years, only to sell out during market downturns.
This is a tale as old time.
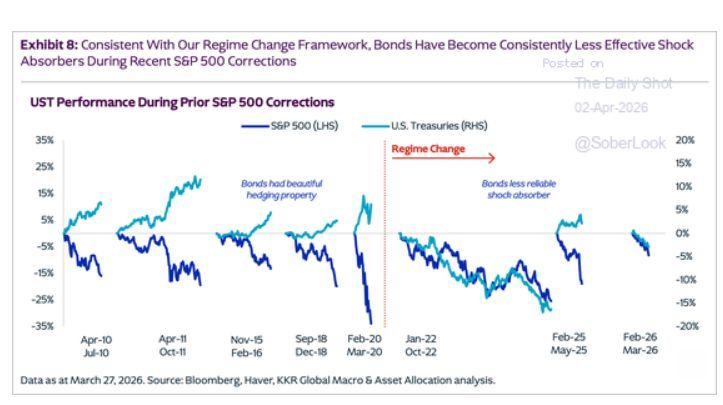
For decades everyone in the asset management industry learned that bonds are the best diversifier to stocks. Then inflation came and ruined the relationship but allocators have been slow to move to find better diversifiers in this environment even when they exist.
It was a great honor to be interviewed by Tyler Wood, CEO of the CMT Association.
During the conversation, @GaryAntonacci and I discussed several of the key ideas behind our paper “A Century of Profitable Industry Trends”, which received the 2025 Dow Award for Best Paper of the Year.
We will most likely present this research in Boston this May at the annual CMT Symposium.
🎥 You can watch the full interview here
https://t.co/B455Q3Nd2Q
While everyone holds bonds (-1% YTD), far too few hold these true diversifiers which have delivered this year:
Oil ($USO): +80%
Diversified Commodities ($BCI): +23%
Managed Futures: +7%
Global Macro: +5%
Gold: 5%
@factor_members I do a lot of TF with ETFs in my SEC-based advisory practice, and I have found that combining TF with swing trading for exits/entries helps to moderate the givebacks and late entries in pure trend following—not always but generally across a large number of trades.
Congratulations to the 2025 winners of the Charles A. Dow Award, Gary Antonacci and Carlo Zarattini, for their brilliant paper, “A Century of Profitable Industry Trends.”
https://t.co/RWdUK9xj3k