Open source frontier AI models will drive demand (token) several orders of magnitude higher than today. In this human AI revolution, SpaceX $SPCX stands to be one of the biggest winners.
1. It will achieve the fastest construction speed per gigawatt for terrestrial data centers, time is money in this race.
2. Its cost per token will be among the lowest, driven in part by the significantly shortened build timeline.
3. With Starship’s successful maturation by year-end, SpaceX will possess lower-cost and near monopolistic space transportation capabilities, positioning it as the clear leader in low Earth orbit satellite data centers with the lowest structural costs also lowest running costs.
4. It has entered an exclusive partnership with NVIDIA.
If developments unfold along these lines and you still fail to recognize what will happen over the next two to three years, you risk missing the single greatest opportunity of your investment career.
NFA
this is f*cking gold
How to build your first AI agent (Full guide)
if I had this a year ago, I would've shipped my first app in a day instead of 2 weeks
in the right hands, this changes everything:
APPLE JUST SHOWED HOW TO RUN 10 AI AGENTS LOCALLY ON MAC - NO CLOUD, NO API KEYS, ZERO COSTS
00:10 Apple engineer says: "your data stays on your device, AI available anywhere at any time, zero usage costs"
agent reads your code, checks GitHub, finds what needs attention and writes a report - all on your Mac, nothing goes to the internet
10 agents work simultaneously - one writes code, another tests, third fixes bugs - parallel with no queue
built a full iPad app from scratch in 2 minutes, fixed its own mistakes and compiled without issues
takes 5 minutes to set up - and you never pay again for a bot that runs 24/7
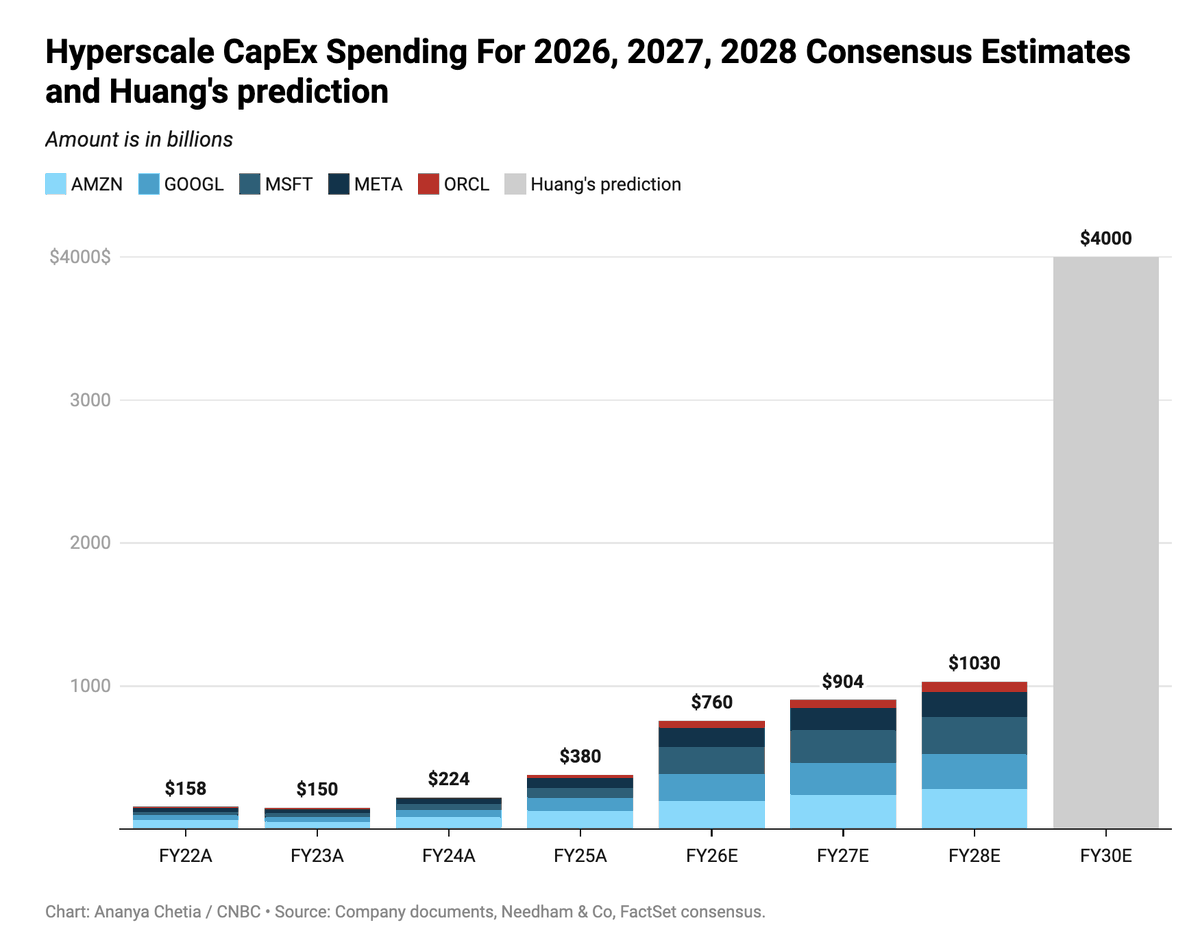
AI capex spend is expected to go to "$3 to $4 trillion annually" by 2030 from $NVDA Jensen Huang projections.
You're not bullish enough.
And it might be a good idea to stay exposed + own the keys of the AI Kingdom:
-> $AXTI controls the materials buildout with photonics.
-> $SOI controls the AI buildout with silicon photonics.
-> $SIVE controls laser chokepoints for CPO.
-> $IQE controls Western epiwafer supply chains for photonics.
All these started off as tiny companies, yet the trillions of projected capex gradually upward to them.
There's many more in other industries as well.
-> AI Capex flows to Neoclouds like $NBIS.
-> AI Capex flows to memory like $MU and $SNDK.
And many of the "commodity" materials or "science projects" for the past 20 years now a sudden shift in exponential TAM expansion.
We're witnessing the next industrial revolution with Artificial Intelligence + Physical AI.
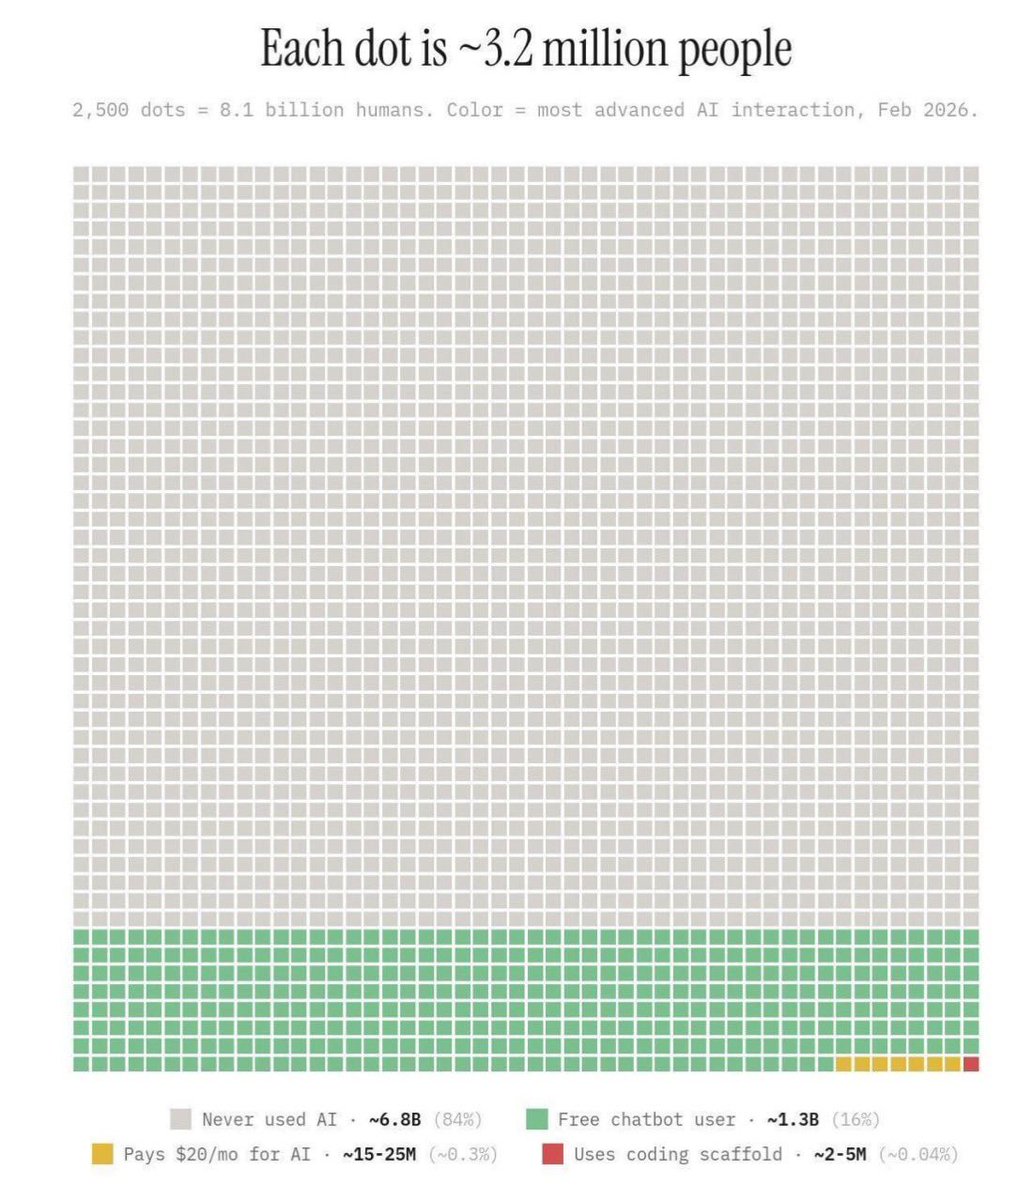
Look at this image
THIS is why AI is the greatest opportunity in human history right now
It's the most powerful technology ever created, yet about .01% of people are using it properly
In a decade 75% of this chart will be red. Until then you have the greatest arbitrage opportunity to use this tech to build INCREDIBLE businesses
Everyone using OpenClaw, Claude Code, and Codex to build and automate their lives have an OBSCENE advantage right now
If you're not, I'd take these steps immediately:
1. Install OpenClaw/Hermes
2. Brain dump everything about your life and career
3. Ask it what tasks it can automate
4. Ask it what businesses you can build
5. Download Claude Code or Codex depending on what subs you have
6. Take the plan from OpenClaw and put it into your builder of choice
7. Build the business
8. Talk about it on social media
Do these steps and you're literally in the top .01%
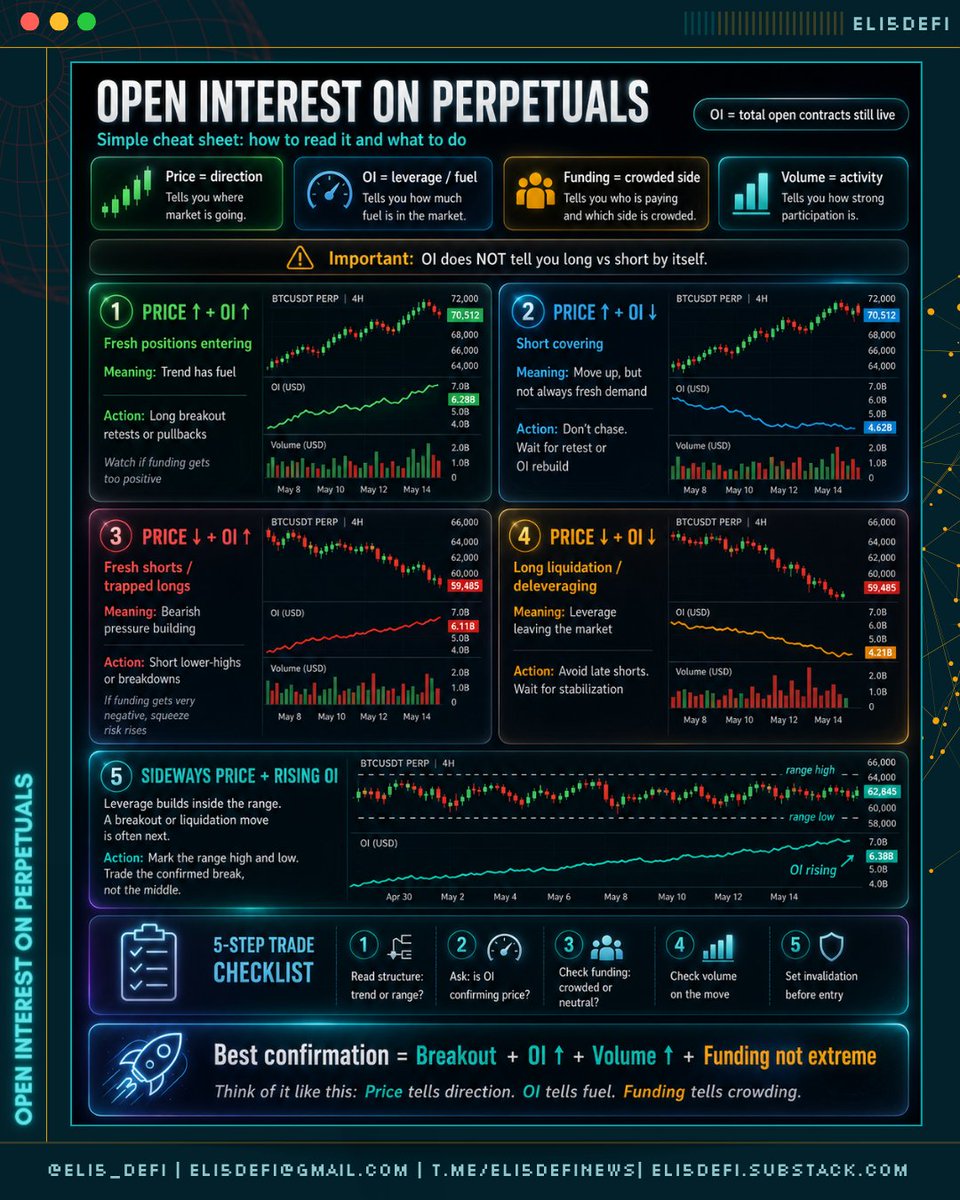
Let’s talk about Open Interest (OI), since many of you might not know what it’s supposed to show.
Open Interest = how much leverage is currently open in the market.
OI does not tell you whether traders are mostly long or short. It tells you how much active positioning exists.
- When OI rises, more contracts are being opened than closed.
- When OI falls, more contracts are being closed than opened.
Think of it like this:
- Price = direction
- Volume = activity
- Open Interest = fuel
- Funding = who is paying to stay in the trade
Funding matters because, in perpetual futures, longs and shorts pay each other periodically.
- Positive funding means longs pay shorts.
- Negative funding means shorts pay longs.
So, funding helps you see which side is more crowded.
For a quick cheat sheet, check below ⤵
INSTEAD OF WATCHING NETFLIX TONIGHT
Spend 1 hour with this Bloomberg Terminal lecture.
It will teach you more about how markets actually work than a 2-month internship at Goldman Sachs or JPMorgan.
Goldman analysts pay $25,000 a year just for terminal access.
You are getting the full lecture for free.
The traders who watch this tonight will understand something most people spend YEARS trying to figure out on their own.
The ones who skip it will keep blaming the market for their losses.
Completely free.
Bookmark this before you scroll past it.
TIL you can pull the backlinks to any domain for free (instead of using a service that charges hundreds a month) using Common Crawl's web graph. Wrote a tiny bash script:
https://t.co/KDVhYMjhq8
here is the prompt I used on @perplexity_ai max (Computer)...feel free to mess around with the weightings, etc.
-----------------------
PROMPT: Build “Should I Be Trading?” — Bloomberg Terminal-Style Market Dashboard
Build a live, auto-refreshing Bloomberg Terminal-style web dashboard called “Should I Be Trading?” that evaluates the current stock market environment and outputs a clear, actionable trading decision for swing traders.
---
Core Output
The system must display:
1. Decision: YES / CAUTION / NO
2. Market Quality Score: 0–100%
3. Execution Window Score: 0–100% (separate)
4. Plain-English Summary: concise explanation of the environment
---
Data Inputs (Live or Latest Available)
Volatility / Risk
- VIX level, trend (5d slope), and 1-year percentile
- VVIX (if available)
- Put/Call ratio (estimate if needed from VIX regime)
Trend & Structure
- S&P 500 (SPY) vs 20 / 50 / 200-day moving averages
- QQQ vs 50-day moving average
- SPY 14-day RSI
- Market regime classification: uptrend / downtrend / chop
Breadth
- % of stocks above 20d / 50d / 200d moving averages
- NYSE Advance/Decline line + daily ratio
- Nasdaq new highs vs new lows
- McClellan Oscillator (optional if available)
Momentum / Participation
- All 11 S&P sector ETFs: XLK, XLF, XLE, XLV, XLI, XLY, XLP, XLU, XLB, XLRE, XLC
- Top 3 vs bottom 3 sector performance (relative strength spread)
- % of stocks making higher highs
Macro / Liquidity
- 10-Year Treasury yield (level + short-term trend)
- Dollar Index (DXY trend)
- Fed stance (derived or labeled: hawkish / neutral / dovish)
- FOMC calendar (flag if event within 72 hours or same day)
- Optional: CPI / Jobs flags
---
Scoring System
Calculate category scores (0–100):
- Volatility: 25%
- Momentum: 25%
- Trend: 20%
- Breadth: 20%
- Macro/Liquidity: 10%
Then compute:
Market Quality Score = weighted average
---
Decision Logic
- 80–100 → YES
Full position sizing, press risk
- 60–79 → CAUTION
Half size, A+ setups only
- <60 → NO
Avoid trading, preserve capital
---
Execution Window Score (Critical Layer)
Separate score that evaluates whether setups are actually working:
- Are breakouts holding above pivot levels?
- Are leading stocks maintaining gains after breakout?
- Are pullbacks being bought quickly?
- Is there multi-day follow-through?
Score 0–100 and factor into final explanation (but NOT the main score weighting).
---
UI / UX Requirements (Bloomberg Terminal Style)
Visual Style
- Dark blue/black background
- Monospace font
- Green / red / amber indicators
- Minimal, dense, high-signal layout
---
Layout
Top Bar
- Scrolling ticker (SPY, QQQ, VIX, DXY, TNX, sectors)
- Status indicator: LIVE / UPDATING
- Last updated timestamp (“updated 12s ago”)
- Manual refresh button
---
Hero Panel
- Large “Should I Trade?” decision badge (YES / CAUTION / NO)
- Circular score visualization (0–100%)
- Subtext: “Market Quality Score”
---
Core Panels (Grid)
Each panel includes:
- Current value
- Direction (↑ ↓ →)
- Interpretation (healthy / weakening / risk-off)
Panels:
1. Volatility
2. Trend
3. Breadth
4. Momentum
5. Macro
---
Sector Heatmap
- Horizontal bar visualization of 11 sector ETFs
- Highlight leaders vs laggards
---
Scoring Breakdown Panel
- Show weight + score per category
- Visual contribution to total score
---
Alert Banner
- Display when FOMC / CPI / major macro event is imminent
---
Terminal Analysis (AI Layer)
Generate a short explanation like:
“This is a strong trend environment with expanding breadth and moderate volatility. Sector leadership is concentrated in technology and industrials. Favor selective swing trades with disciplined risk.”
---
Mode Toggle
- Swing Trading Mode
- Day Trading Mode (adjust thresholds slightly tighter and faster)
---
Technical Requirements
- Auto-refresh every 45 seconds
- Server-side cache (30 seconds) to reduce API load
- Loading skeleton states while fetching
- Error handling for missing data
- Modular architecture (easy to swap APIs)
---
Output Requirements
Return:
1. Full frontend layout (React preferred, Tailwind optional)
2. Backend/data aggregation logic (Node or Python)
3. Clear scoring formulas (editable)
4. Example output using current/latest market data
5. API recommendations (free + paid)
---
Success Criteria
- Clean, fast, high-signal UI
- Accurate regime detection
- Simple, trustworthy YES / NO output
- Feels like a personal risk manager, not just a data dashboard
♥️Luc