Investor. World-curious. Change & progress. Ambitious, in pursuit of freedom. Libertarian.
Sharing my investment journey transparently - Not Financial Advice
Small rebranding and reorganisation of the site.
There are now three distinct sections. The transparent portfolio, with all positions still shared openly, remains there, but I’ve now added Macro and Valuation sections for the curious.
I’ll keep populating and improving everything gradually, as I see fit.
Still completely free: no paywall, no registration, and fully transparent.
🔗 https://t.co/HhaRnUe1rb
When looking at past analogs for $SPY's last 6 months and adding the AAII Bull/Bear spread indicator below (new feature on the Orion Engine), you will see that it is in fact quite common for sentiment to detach from price even as we creep back to ATHs.
If anything this indicator should serve as a contrarian signal that the timeline is too bulled up and a short correction is overdue. If we project the price and spread going forward based on past examples, you will see this in practice.
#Bitcoin long-term speculative chart in the context of:
🔸Macro hypothesis that the stock market remains in a secular expansion into the 2030s (see first chart in comments)
🔸 Blood moon season observations (dotted vertical lines)
🔸 Shmita cycles (red background areas)
🔸 Extrapolated power-law model (red and blue lines)
Boring period, right? So a bit of long-term speculation hopium never hurts (but please, never take this for granted).
Enjoy your weekend, all!
#Bitcoin long-term speculative chart in the context of:
🔸Macro hypothesis that the stock market remains in a secular expansion into the 2030s (see first chart in comments)
🔸 Blood moon season observations (dotted vertical lines)
🔸 Shmita cycles (red background areas)
🔸 Extrapolated power-law model (red and blue lines)
Boring period, right? So a bit of long-term speculation hopium never hurts (but please, never take this for granted).
Enjoy your weekend, all!
Literally climbing the wall of worry for two straight years:
“Recession fears”
“Persistent inflation”
“Higher for longer rates”
“China’s economic slowdown”
“Russia/Ukraine escalation”
“The yen carry trade unwind”
“US election uncertainty”
“Tariffs and trade war fears”
“US debt and rising bond yields”
“Government shutdown and debt ceiling fears”
“AI bubble narratives”
“The Iran/US war”
“Oil shock/Hormuz fears”
“Rate hikes again”
“US midterm election uncertainty”
What else?
@_CryptoSapiens_ Yes, I’d say their influence is visible, as I noted in the post below a few months ago. The real question is the direction of causality: are they buying because the price pumps, or does the price pump because they’re buying? Probably a bit of both. https://t.co/fIZlqMx8uO
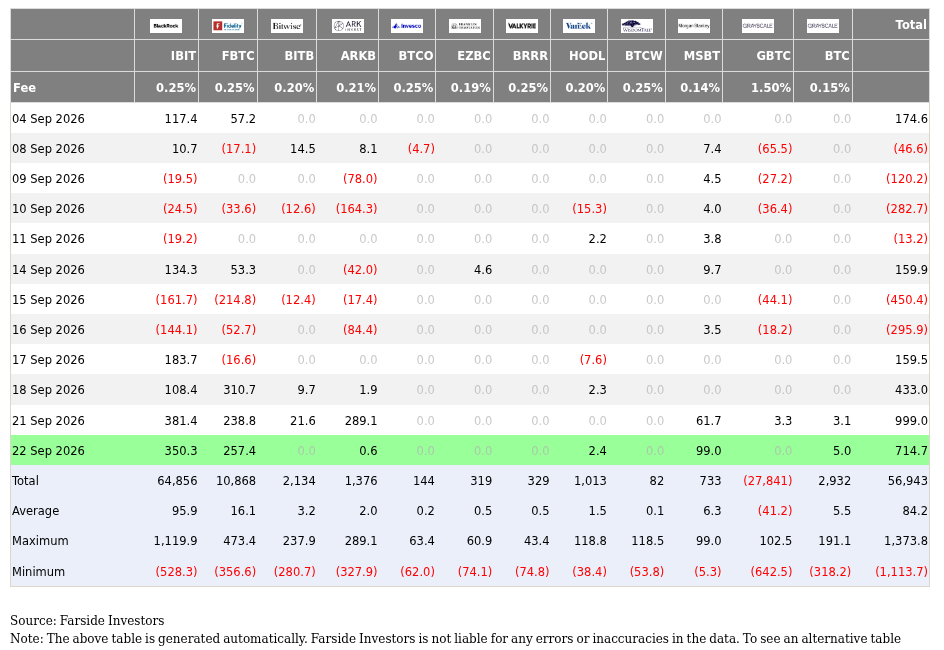
#Bitcoin the influence of the ETFs on BTC price action is quite undeniable lately.
🔸ETFs Assets Under Management (AUM) topped in October → BTC topped in October
🔸ETFs Assets Under Management (AUM) Bottomed in February → BTC Bottomed in February
🔸ETFs Assets Under Management (AUM) bounced till mid May → BTC bounced till mid May
🔸ETFs Assets Under Management (AUM) Bottomed in June ?? → BTC Bottomed in June ???
In basic words:
🔸ETFs sells their coins - BTC dumps
🔸ETFs buys BTC - BTC pumps
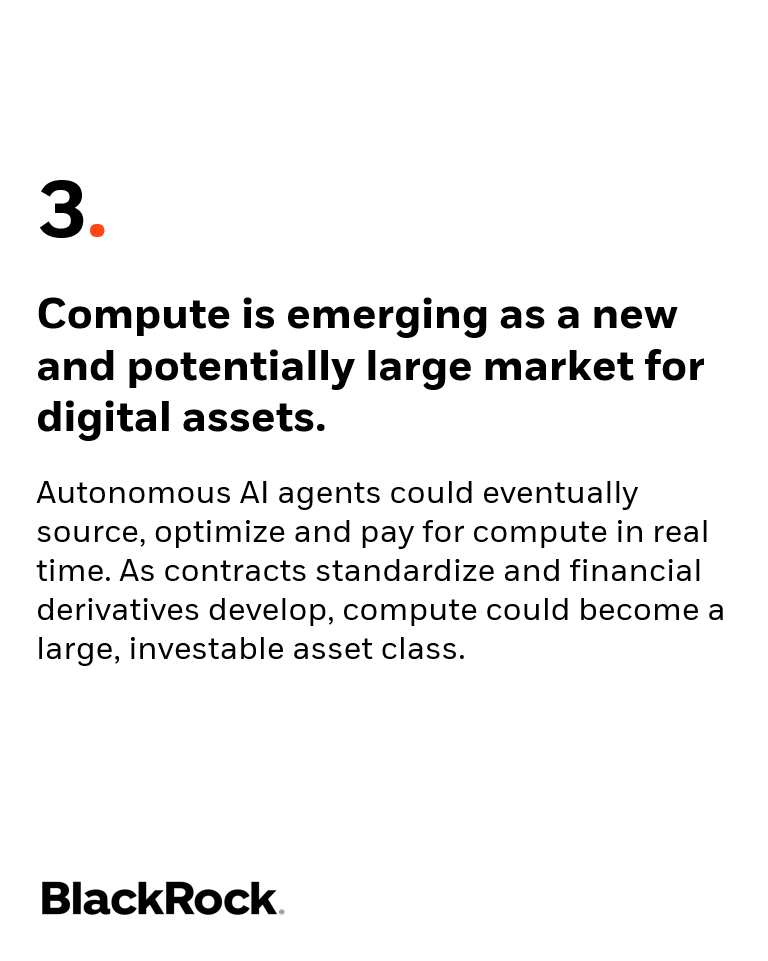
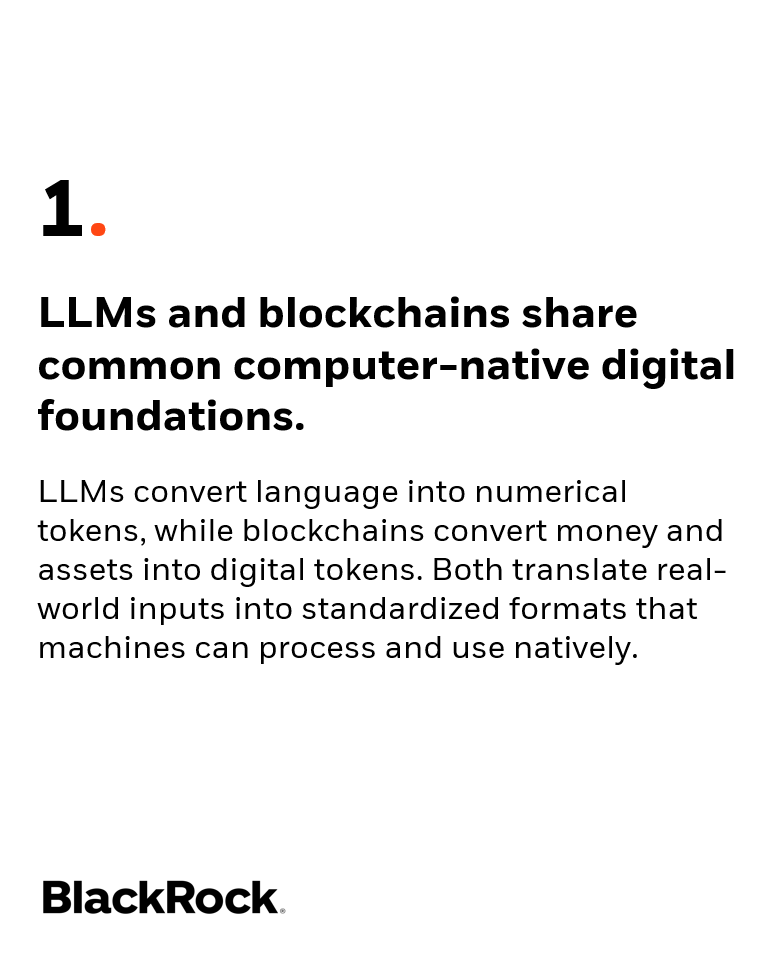
Our latest research paper explores the growing connection between AI and digital assets and explains why broad AI adoption may drive new demand, utility and applications across the digital asset economy. https://t.co/z5T88Orble
You are free to complicate things. Looking at a chart like this all I can see is an uptrend that recently broke out of a 20 year-long consolidation.
The boundary at 4.75 is the new long-term support. #COPPER
All over X, I'm reading #COPPER prices plunge...
Look at this trend and tell me if there was a less volatile period in this uptrend over the past year and a half.