O CEM passa a disponibilizar os resultados eleitorais de todos os municípios brasileiros do período de 2004 até as eleições de 2022. Leia mais em https://t.co/XRDOYuzgdn (Foto: Comunicação/Tribunal Superior Eleitoral)
Time series analysis has been critical in my career. But it took me 3 years to get comfortable. In 3 minutes, I'll share 3 years of experience in time series:
1. Time Series Analysis: Time series analysis is a statistical technique that deals with time-ordered data points. It's commonly used to analyze and interpret trends, patterns, and relationships within data that is recorded over time (e.g. with timestamps).
2. Uses: Understanding and applying time series analysis concepts is critical for forecasting, detecting anomalies, and drawing insights on data that varies over time.
3. The 3 Core Concepts: There are 3 areas of time series that have been super helpful. Understanding 1. Autocorrelation, 2. Seasonal Decomposition, and 3. Calendar Effects. Let's break them down.
4. Autocorrelation: This refers to the correlation of a time series with its own past and future values. It measures the relationship (correlation) between a variable's current value and its past values.
5. Partial Autocorrelation: Autocorrelation has a problem. Some of the correlation is confounded by earlier lags. Enter Partial Autocorrelation. This removes the correlation effect of earlier lags.
6. Seasonal Decomposition (STL): Seasonal decomposition decomposes a time series into three components: trend, seasonal, and residual (irregular). STL stands for Seasonal-Trend-Loess. It uses a "LOESS" smoother to remove seasonal and trend effects. STL is flexible and can handle any type of seasonality, not just fixed seasonal effects. The residuals can be analyzed for outliers since they have been de-trended and de-seasonalized.
7. Calendar Effects: Calendar effects refer to variations in a time series that can be attributed to the calendar itself. This can include effects due to day of the week, month of the year, or holidays tied to the calendar.
Understanding and applying these concepts allows analysts to better forecast future values, detect anomalies, and draw insights from data that varies over time.
===
There’s a lot more to learning Data Science for Business. I’d like to help.
I put together a free on-demand workshop that covers the 10 skills that helped me make the transition to Data Scientist: https://t.co/LR39RJ5XKB
And if you'd like to speed it up, I have a live workshop where I'll share how to use ChatGPT for Data Science: https://t.co/EaMpKrJiqX
My High-Performance Time Series Course: This is an advanced course that shows you how to use my 2 R packages timetk and modeltime for high-performance forecasting. Not for complete beginners. https://t.co/O40JbCkPh1
If you like this post, please reshare ♻️ it so others can get value.
@thaleslcarvalho Parabéns pelo texto, meu amigo. Realmente, sempre existe a possibilidade de se obter ganhos com a ameaça, mas não com o conflito em si. Fico na torcida por um texto seu focando no papel do Brasil neste contexto.
Quer aprender a fazer um mapa eleitoral bonito como esse?
Venha esse domingo pro workshop "Mapas eleitorais com R" no #CodaBr2023 que a equipe do @cepesp te ensina!
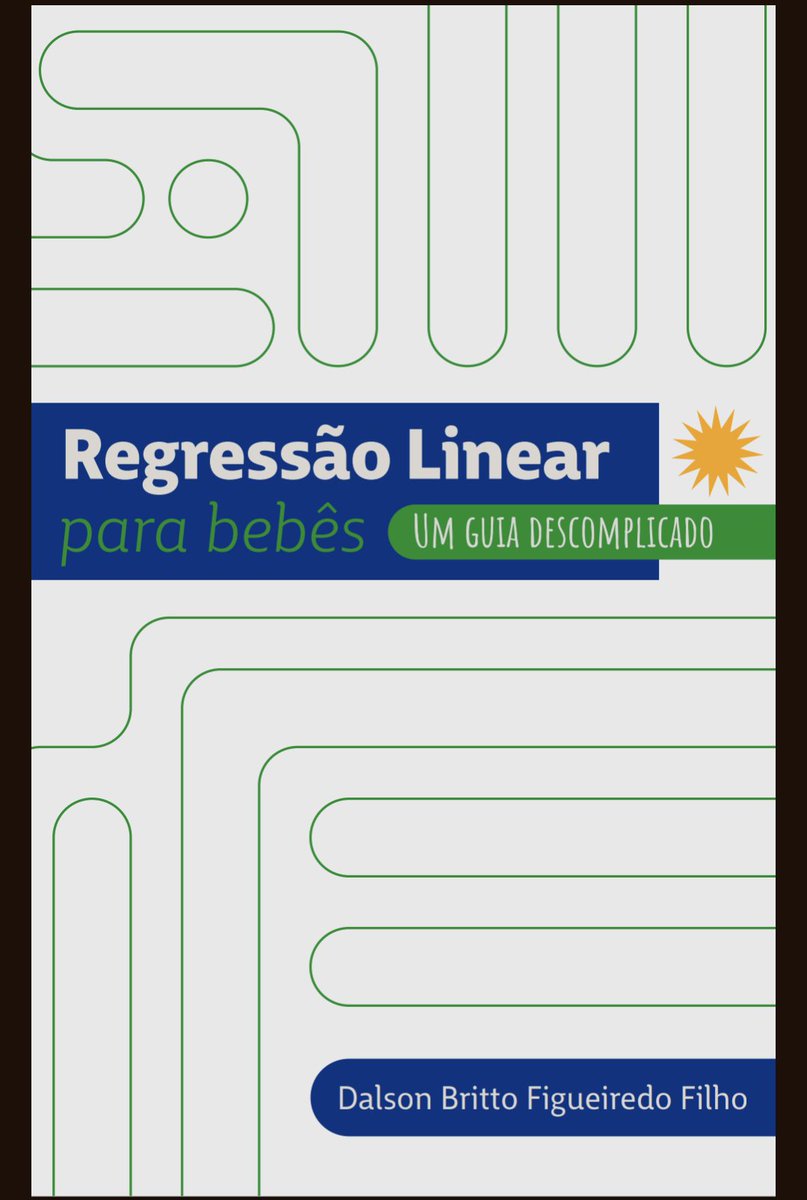
O negócio tá esquentando! Já já teremos a publicação da série para bebês....vai ter correlação, regressão, análise fatorial, análise de cluster, análise espacial, séries temporais, etc
Quem puder ajudar a divulgar, eu agradeço!
@cienciapol
@Cruzeiro Todos querem tratamento trib. especial, pois todos se acham especiais. A PEC 45 tem virado um monstrengo pouco melhor do que o sist. trib. atual, por causa de lobbies injustificáveis como esse. A eficiência do IVA se perdeu quase toda. Sou Cruzeiro de coração, mas me ajudem aí.
ggplot < 10 plots
trelliscope >=10 plots
I wrote a short tutorial to get you started with this amazing tool. ❤️
Article: https://t.co/Eon3vrz33a
#rstats
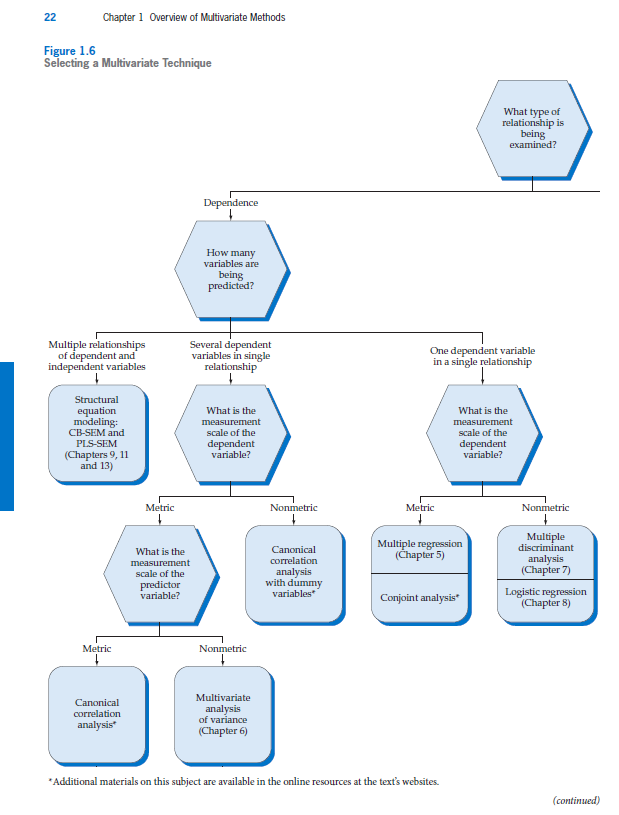
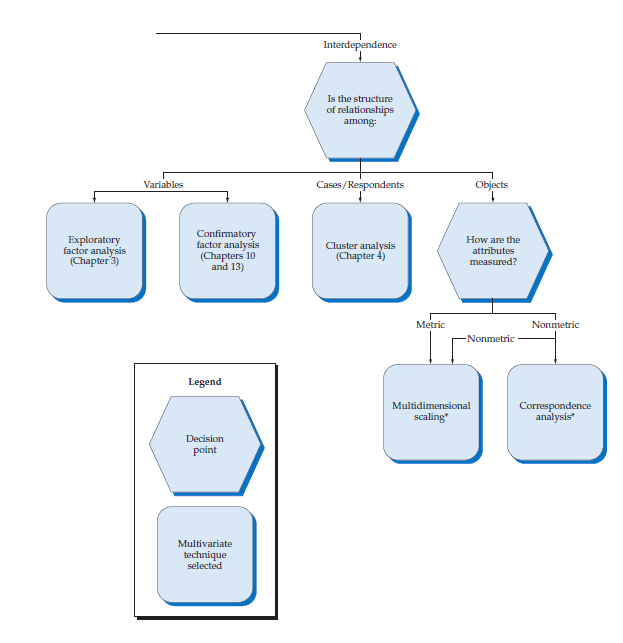
Como identificar a técnica estatística mais adequada considerando o nível de mensuração e a quantidade de variáveis dependentes?
Esse fluxograma, do Hair et al (2019), vai ter ajudar.
Bom dia e bom trabalho!
@ufpeoficial@politicaufpe
Acabei de ler a tese de doutorado do @ea_lazzari sobre os determinantes políticos da regressividade tributária brasileira e já considero como um trabalho de referência no tema. Meus parabéns, Eduardo!
Most academics waste many hours finding literature, illustrating data and editing text.
Instead, use the https://t.co/59Fs5H5IEX All Access Pack, which is a bundle of AI-based academic tools.
These are the apps I would use if I started a PhD today:
Fazer pesquisa nos ensina a confiar em nós mesmos. Confiar que estamos sendo éticos, que pesquisamos e que codificamos corretamente, que lemos direito e que interpretamos adequadamente os nossos dados. Fazer pesquisa é também uma forma de desenvolvimento pessoal.