Depuis ses débuts, le secteur de l'analyse on-chain s’est nettement développé et affiné
Il est désormais possible de créer des modèles on-chain pertinents, épurés et reproductibles
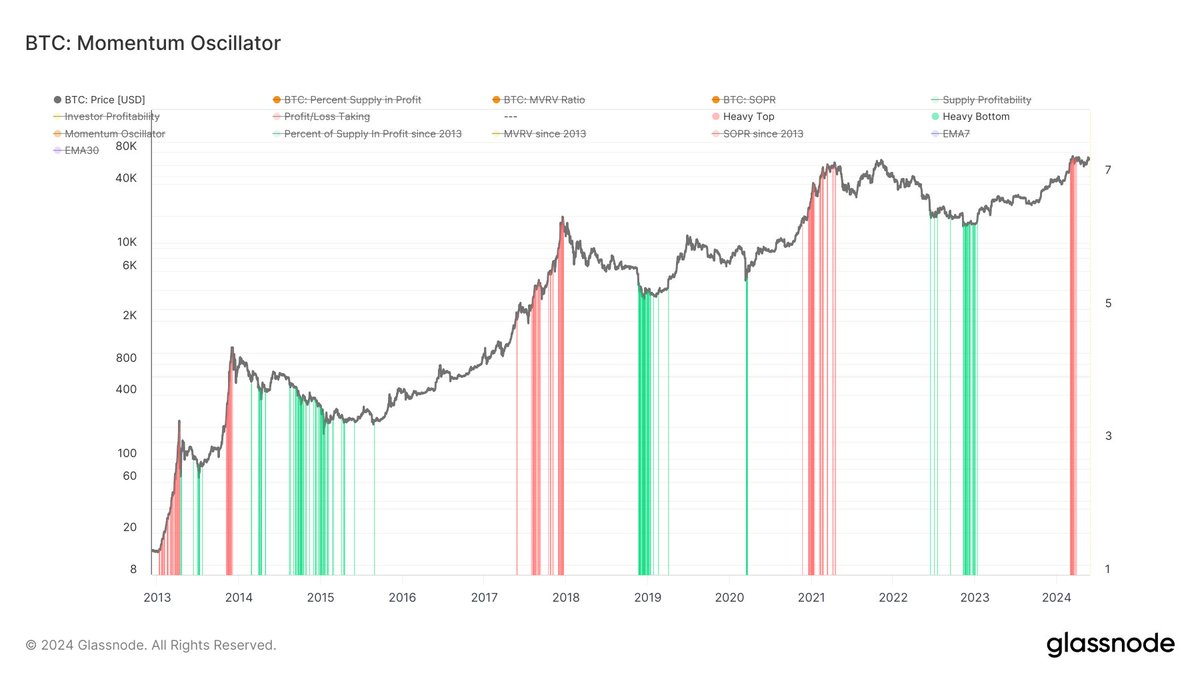
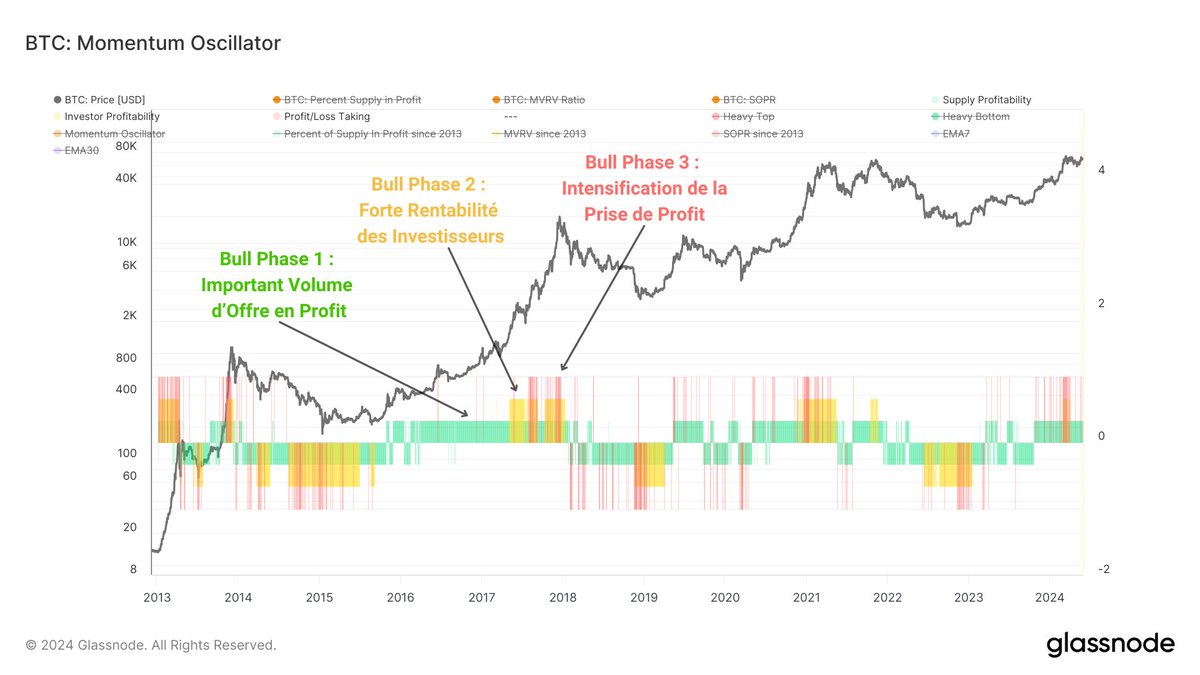
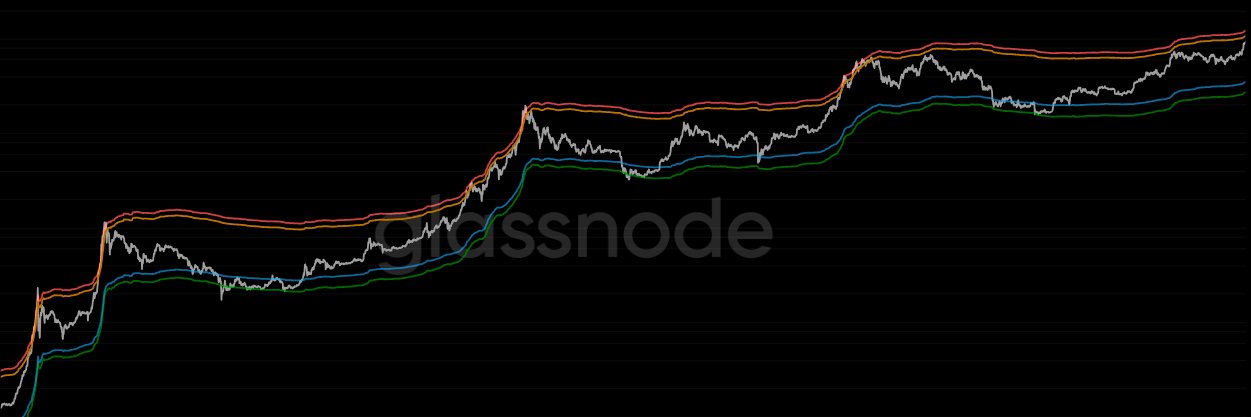
Aujourd'hui, je vous présente un modèle simple et efficace : Le Bitcoin Momentum Oscillator
1/15
A major feature of the 2025-26 Bitcoin bear market was the scale of long-dormant supply returning to circulation.
Across 2024 and 2025, more than 1.3M BTC held for 5+ years were revived onchain, representing over $110B in rotated capital.
Historically, this type of behaviour tends to cluster around major cycle transitions, as experienced holders distribute supply into strong market demand.
The chart below shows just how large that wave of revived supply became throughout the cycle.
If you want to understand how this Bitcoin bear market actually unfolded beneath the surface, download The Bitcoin Checkpoint → https://t.co/Oa3FlKZZNI
The Life Cycle of Bitcoin - a full history of Bitcoin's URPD in 4K
500 price bins histogram
y-axis capped at 98th percentile
22 age bands (older stacked atop younger)
Powered by Bitcoin Research Kit @_nym21_
made a SOPD History time series chart to study how SOPD move with BTC over time: https://t.co/9KSzZIww5L
All credit goes to the valuable data from Bitcoin Research kit by @nym21, @_Checkmatey_'s teachings on his substack and @renato_shira
added coindays and valuedays for both sopd and urpd, toggle for newly mined coins to capture the full flow picture (what's sold + what's produced). Keyboard controls are the same
Bears are paying 12% interest rates to be short.
Liquidations heavily skewed to the short side.
Options still heavily dominated by fearful put buying.
Deep OTM puts command a 10 to 20% premium vs calls.
The bears really, really, really want price to go lower...
Inspired by the great work completed by @RenshuBTC, and buyilding on @_nym21_'s brilliant Bitcoin Research Kit, I have just shipped a new URPD tool.
Allows analysis of how the profile of BTC, USD and Unrealised PnL changes over time, and by cohort.
https://t.co/Eq8X70GGrY
$BTC What an absolute beauty of a profile. A nearly perfect distro. This range is cooked. Stick a fork in her.
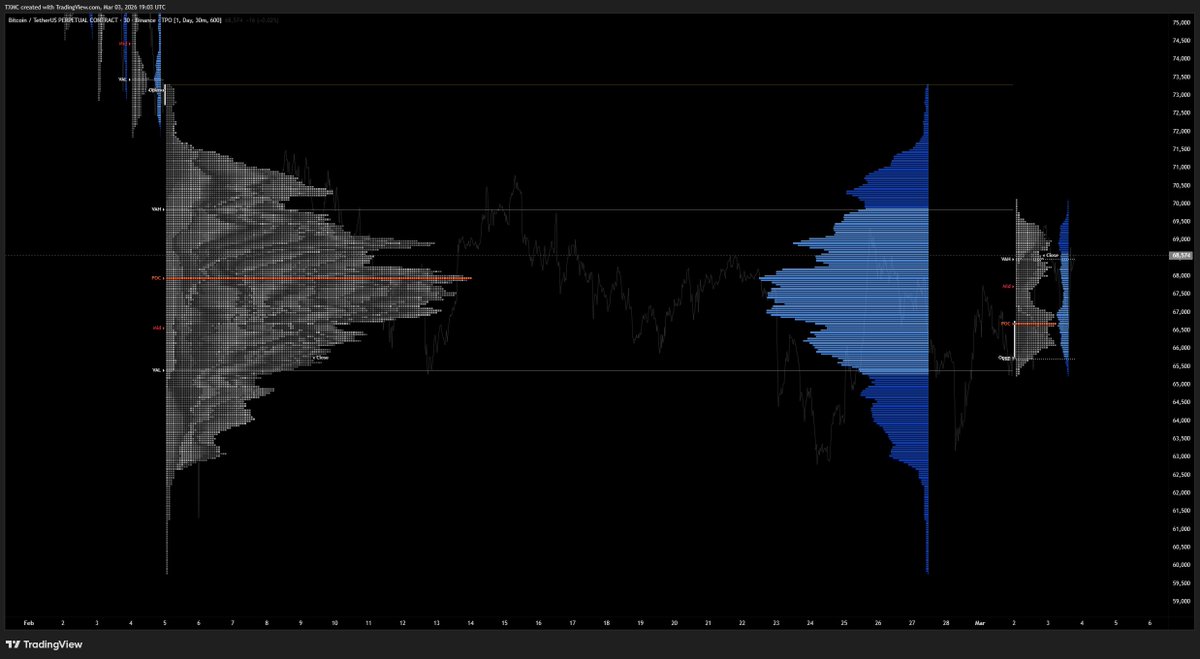
Which way next bros? Up & out? Or we pumping before the next level of Hades? Either way, once we leave this 65-70 area, any return is likely to cut thru like a laser.
The new RBN v12 is a different beast - built to leverage multiple languages, and far more powerful than RBN v11.
Still, I am moved to say goodbye to R. For science and statistics, it’s still my first choice.
Bitcoin Lab lives on serving on-chain data.
👉https://t.co/CWsmLarkTV
Two levels define this market right now.
Above: True Market Mean at $79.2K. We lost it two weeks ago.
Below: Realized Price at $55K. The aggregate cost basis of the entire network.
In 2018 & 2022, BTC spent months trapped between these two levels.
That was the "time pain" phase. The boring, grinding, hope-killing part of the bear.
We just walked through the same door.
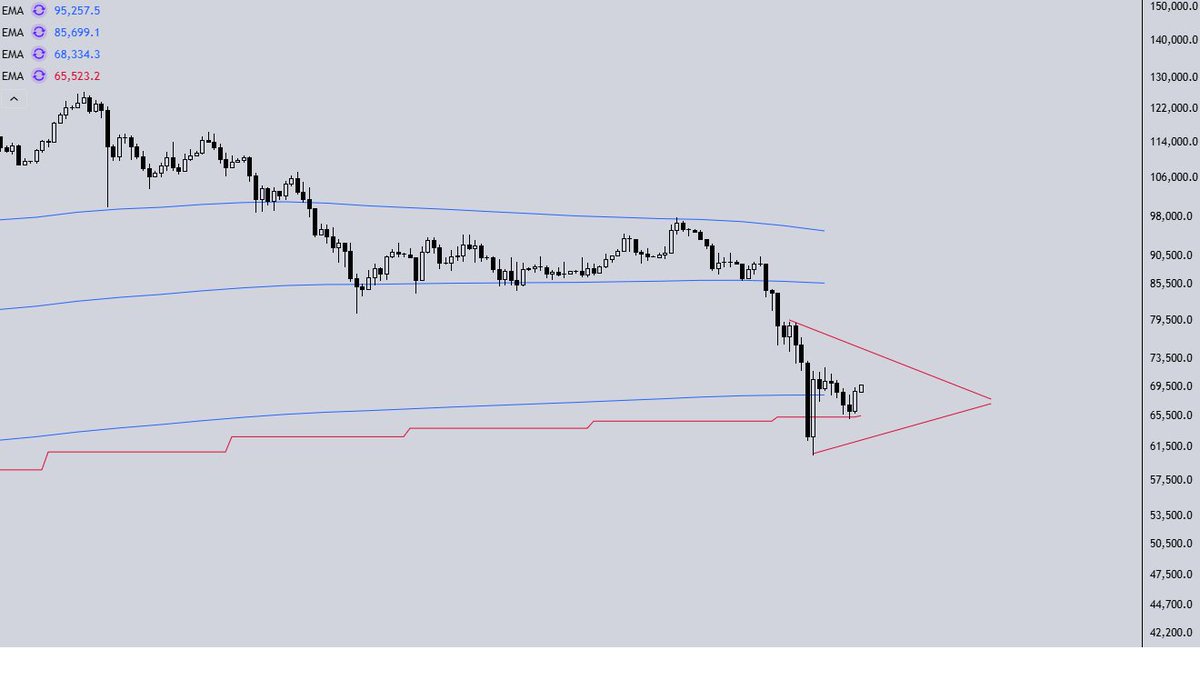
$BTC est bien entré dans une période de faible volatilité et suit notre description post nuke de début février. Dans cette configuration, il faut laisser l'action de prix se développer: rien ne change tant qu'il reste dans ce triangle.
https://t.co/WsJoOTtaTl
Avec la période extrêmement volatile que nous venons d'avoir, la probabilité que les prochaines semaines correspondent à une compression du prix est très grande.
Que $BTC pump ou dump en premier, nous nous attendons à ce qu'une consolidation se forme entre ~62-75K$.
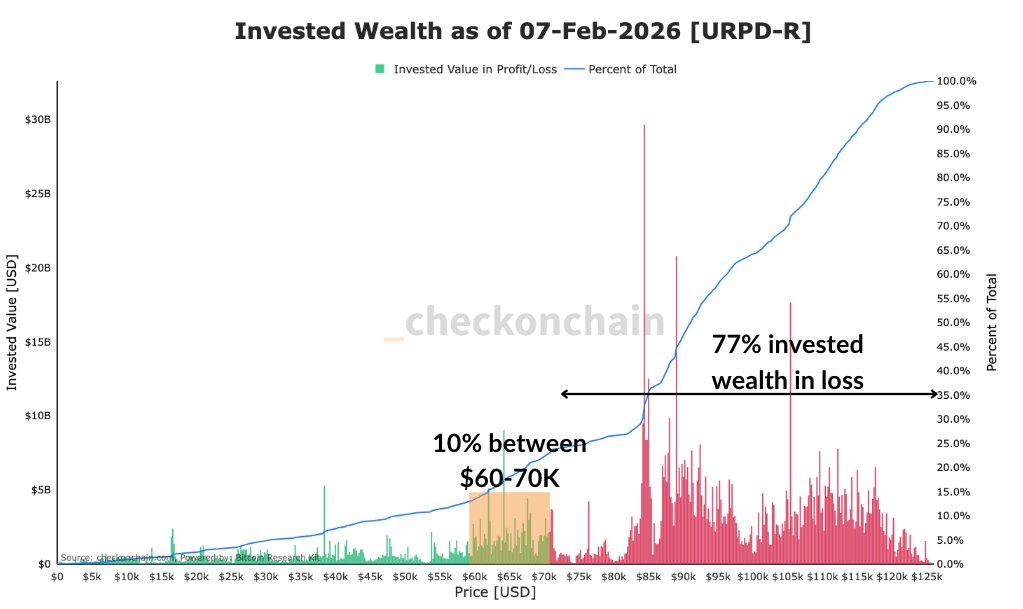
77% of all invested wealth in Bitcoin is already at a loss.
The market has already broken most people.
But 10% of all invested wealth sits in the $60-$70K cluster, holders who watched $126K and didn't sell.
Either the market breaks them too, or this is where the floor forms.
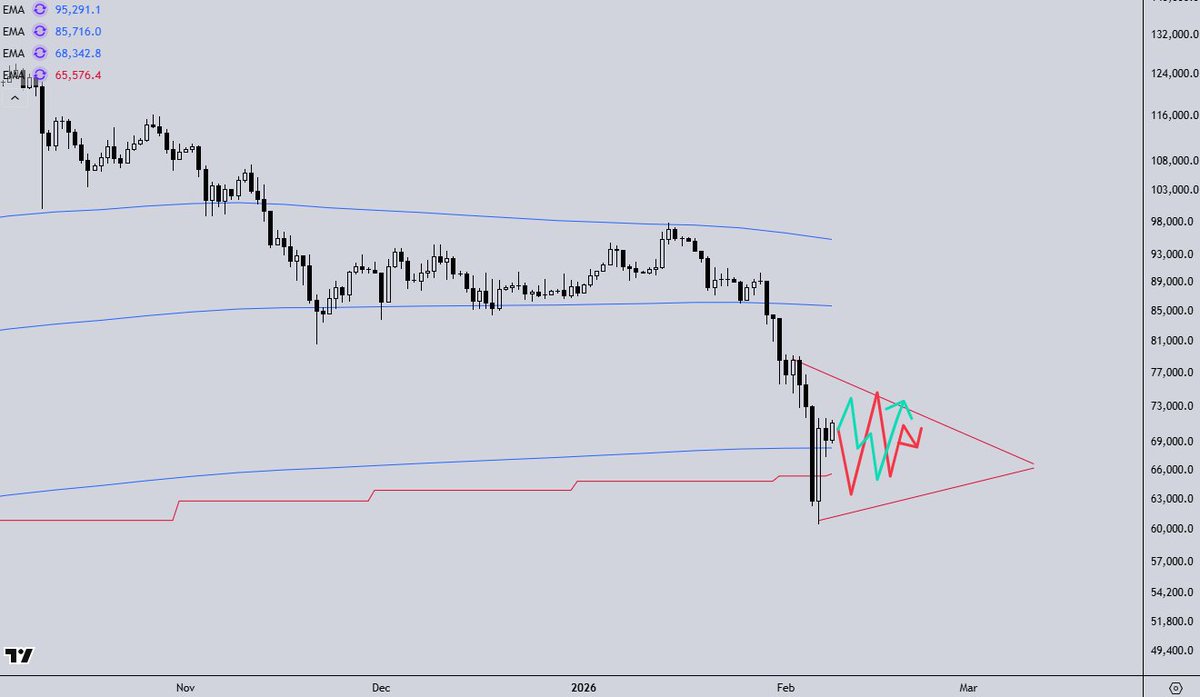
Beau rebond de $BTC hier qui fait suite à notre denier post dans lequel nous expliquions que 60K$ avait de grandes chances d'être un bottom moyen-long terme.
Tout pointait vers un pic du momentum que ce soit au niveau du volume échangé, du sentiment global, des contrats d'option.
Il est temps de faire un rappel sur les lois qui régissent tous les marchés financiers:
Tout investisseur un minimum informé sait qu'un actif ne peut se trouver que dans deux environnements
- Tendance haussière/baissière
- Consolidation
Mais on peut également classifier l'action de prix en fonction de la volatilité et du momentum.
Bitcoin passe par des périodes de hautes volatilité et de fort momentum à des périodes de faible volatilité sans aucun momentum.
En règle générale, il est admit que BTC passe 70% de sont temps dans des périodes de faible volatilité sans aucun momentum.
Les grandes appréciations de prix, là où tout le monde gagne de l'argent, ou les périodes de crash ne se font que dans un laps de temps très court.
C'est parfaitement visible sur le chart en weekly. Nous venons d'avoir deux périodes de fort momentum vers le downside.
L'attention autour de BTC atteint son pic en même temps que la volatilité. Tout le monde commence à prendre des décisions hâtives dans la panique. Les dernières chandelles vous ont surement donné envie d'acheter/vendre, prendre des Longs/shorts etc.. car vous avez l'impression que tout se joue maintenant.
Vous aurez l'impression que chaque petit pump/dump est le début d'un mouvement plus grand.
En réalité, la nature des marchés fait qu'il ne se passera probablement rien pendant 1 mois. Les marchés financiers sont très forts pour vous faire changer d'avis d'un jour à l'autre alors qu'en dézoomant, la situation n'a pas bougé d'un pouce.
Eviter les périodes de chop est primordial pour manager votre portefeuille. C'est probablement le pire moment pour prendre une grande décision car BTC sera surement au même niveau fin février.
Si vous ne devez retenir qu'un seul concept pour la gestion à long terme:
Evitez les zones bleues et identifiez le plus rapidement possible l'entrée en zone verte.
Vous surperformerez la plupart des traders de ce réseau social.