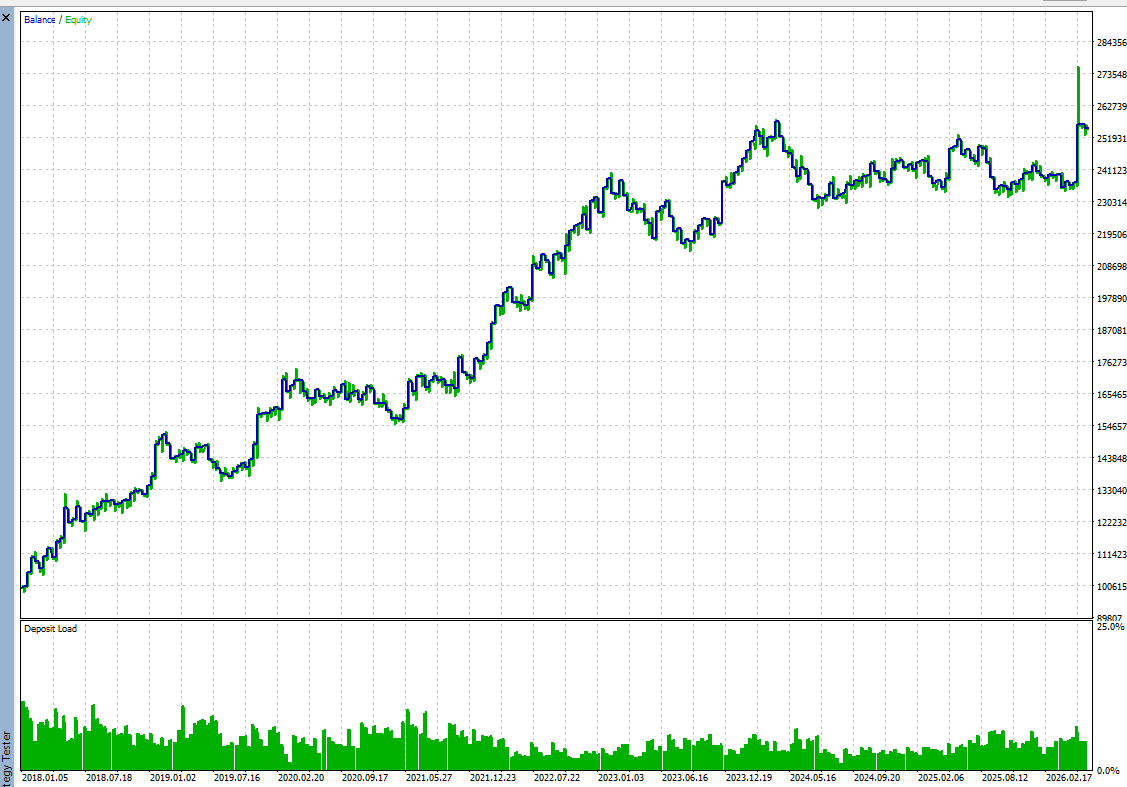
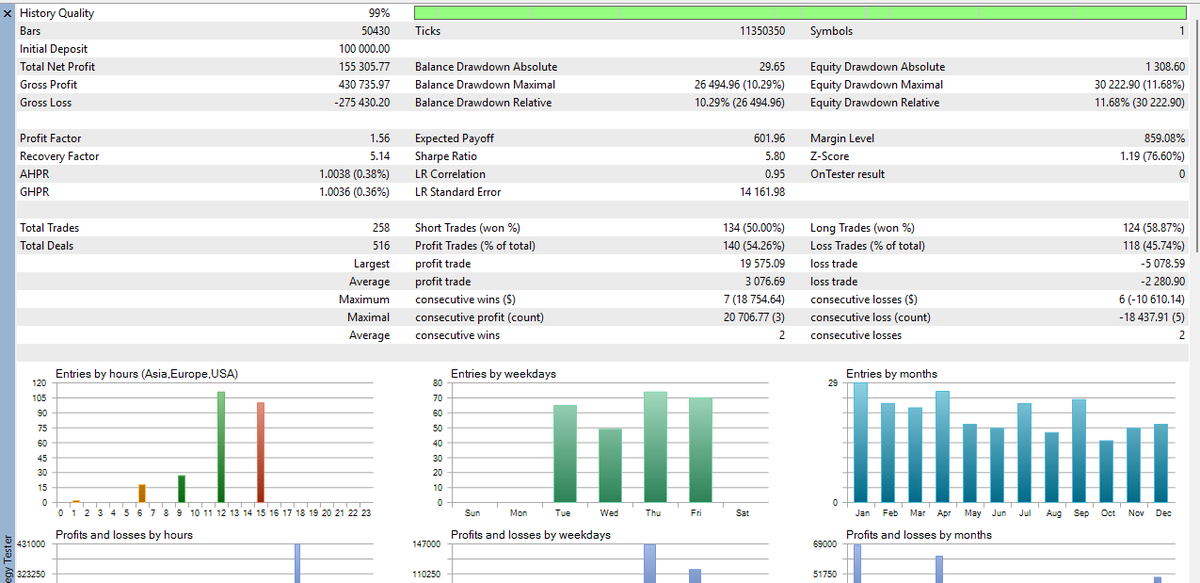
I ran 16.5 million filter tests on NASDAQ.
One condition beat every other oscillator, trend indicator, volatility filter, and volume condition.
The winner: a simple CCI correction filter.
Exact rule for long entries:
Lowest(CCI(27), 18 bars) < –100
In plain English:
Only take the long breakout if, somewhere in the last 18 bars, CCI(27) dipped below –100.
(i.e. the market has already had a real correction)
Results across 1,000 strategy variations:
> Net profit improved on 69% of strategies
> Average trade improved by 22% on more than half
> Bounce index: 57.8% (turned that many losing variations profitable)
On the base NASDAQ breakout:
Profit/drawdown ratio: 7.53 → 8.6
Average trade: $116 → $149
Why it works:
Breakouts taken after a genuine washout have room to run.
Breakouts taken into already-extended strength tend to fade.
This wasn’t tested on one strategy.
It was stress-tested across 1,000 different ones.
That’s the difference between a filter that looks good and a filter that actually travels.
A Profitable strategy to code 👇 :
- RMI Trend Sync Strategy
Strategy Overview :
- This strategy is designed to synchronize momentum with the broader market trend, ensuring that you only enter trades when both forces are aligned.
- It utilizes the Relative Momentum Index (RMI)—a variation of the RSI that accounts for momentum duration—combined with the Money Flow Index (MFI) to gauge the strength of price movement. To filter out noise and manage risk, the strategy overlays a Range Weighted Moving Average (RWMA) and a SuperTrend filter. The "Sync" in the name refers to its core philosophy: entering only when short-term momentum (RMI/MFI) synchronizes with the longer-term trend direction defined by the SuperTrend.
- This multi-layered approach excels at capturing sustained moves while providing dynamic exit points to protect profits. Recommended Settings Trade Direction: Like many professional scripts, it defaults to "Both." For best results in a defined bull market (or bear market), switch this setting to "Long" (or "Short") to align with the macro environment. Timeframe: This strategy is particularly robust on higher timeframes. The metrics below reflect performance on the 4H chart, where the noise is reduced and trends are more reliable.
I am exciting to bring you the Trinity SuperTrend Strength Index. This is different from a normal SuperTrend. If you would like to try it and send me feedback then add your TV name, but please send me feedback for anything you can suggest to improve: https://t.co/ApXg6NkSJw
A classic SuperTrend usually takes the midpoint of the bar (HL2), adds and subtracts a fixed ATR multiple, and flips whenever price closes beyond the band. It has no built-in sense of whether the market is trending or ranging, no higher-timeframe veto, and no continuous strength reading.
Trinity changes several fundamentals:
The center is a real moving average you control (especially useful with VWMA on stocks and crypto).
The width of the band adapts to ADX instead of staying fixed.
Flips can be blocked in low-ADX environments so the line does not thrash in ranges.
Flips can be blocked when higher timeframes disagree.
You receive a continuous ATR-normalized strength score instead of only a binary up/down color.
That strength score, together with ADX direction, higher-timeframe alignment, and optional CCI or relative-volume filters, produces named states: Strong Bull, Bull, Neutral, Bear, Strong Bear.
The result is a line that behaves more like a structural trend filter and less like a reactive stop that flips on every noise spike.