@yq_acc The single biggest problem with crypto:
Devs got used to easy funding & aren't competitive with web2 startups
For yrs crypto gave no need to deliver
- useful products
- sustainable revenue
..& yet multi Billion valuations
Reality has arrived:
create real value or leave
Life is chosen suffering - that's all it is, we have to pick the suffering that gives us the most meaning in exchange.
IF we do not pick, we are assigned a form of suffering; e.g. mediocrity in your career is a form of suffering. Being obese and unfit is a form of suffering.
To live is to suffer, but being able to pick your choice of suffering is a form of bliss.
Haseeb, ETH lives or dies on one thing:
build useful apps, all else is noise
→ Infra trajectory is already great
→ Apps (with real usage) are the make-or-break variable
This hand-drawn chart is over 90 years old.
Jesse Livermore sketched it in the 1930s to show his students how every speculative stock moves through the same numbered phases:
– Points 1–4: Accumulation cylinder, smart money quietly buying
– Points 5–7: The all-important action, breakout, volume, the rally begins
– Points 8–13: The test before selling short, final euphoric peak, lower high
– After 13: Distribution and collapse
Look at where we are right now.
Micron, SanDisk, the DRAM ETF, Oracle, SMCI, AppLovin, Nvidia – all sitting somewhere between points 8 and 10. Vertical moves. Record volumes. Headlines turning euphoric.
Palantir is further along. Maybe 12 or 13. The phase Livermore literally circled and labeled "test before selling short."
This is where the most money is made in the shortest time in any market cycle. Bull markets are won in this zone. Life-changing returns are compounded here.
But it is also exactly the phase where Livermore lost three fortunes.
Because the same energy that drives a stock from point 8 to point 13 quietly pushes it past 13.
The setups today are real. The opportunities are real. The money being made is real.
The sell rules still apply.
– Trim into strength, not weakness
– Take partial profits at the 20–25% mark
– Cut losses at 7–8%, no exceptions
– Watch for the climax run signature
Make money on the way up.
Just don't give it all back on the way down.
Livermore wrote the rulebook on this. He still ended up broke.
The chart never changes. Because the chart isn't drawing the stock. It's drawing the people who own it.
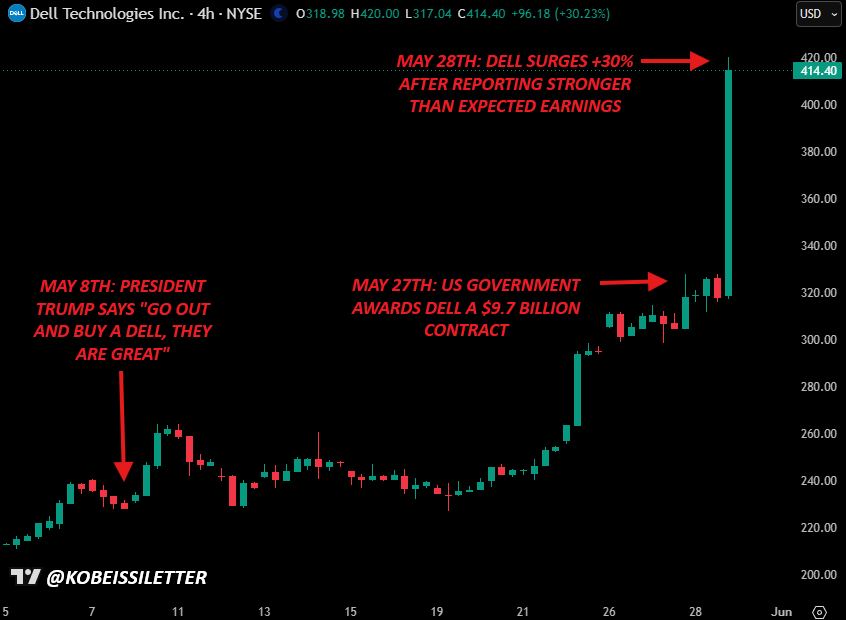
President Trump is undefeated in the stock market.
On May 8th, President Trump told everyone to "go out and buy a Dell."
19 days later, on May 27th, Dell was awarded a $9.7B contract with the US Pentagon.
Today, Dell, $DELL, reported stronger than expected earnings and the stock surged +30%.
Dell's stock is now up +80% since May 8th, adding +$120 BILLION in market cap.
Truly unprecedented.
@zeroxkyle IRL + Physical world hv moats
AI training data is 100x > Robotics training data
(Robotics will take decades longer to replace physical world)
@adamscochran There's only one way out for Trump;
He's already made a soft deal with Iran and he's just saber rattling to save face
Then comes out with "they listened to my threats and they backed down"
..without that, Trump & markets are screwed
@ericnuttall Devil's advocate:
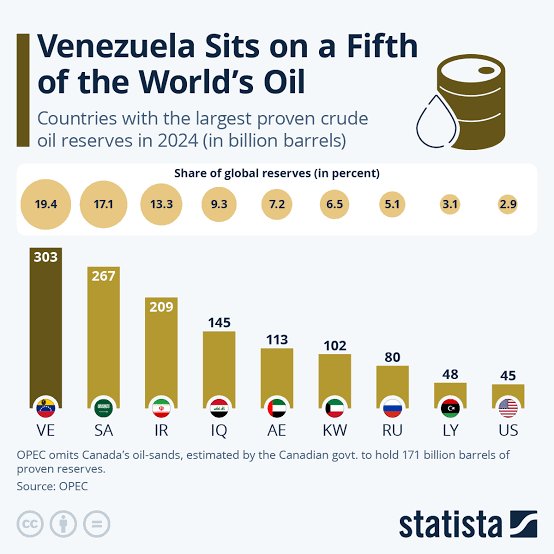
1. US now hv Venezuelan latest global supply (will take time, but its coming)
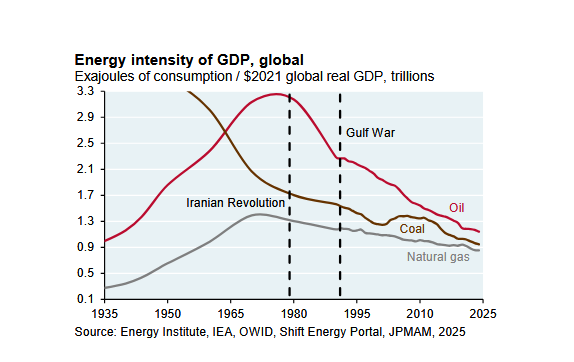
2. Oil intensity keeps declining (and will continue with solar + nuclear)
https://t.co/b0EwYHT9IR
As everyone scrambles for oil and gas, its worth appreciating the world's energy intensity has fallen precipitously over the last 45 years.
The chart and table from JP Morgan illustrate how relentless the push to doing more with less has been.
@0xNairolf we need better ratings (surely with AI its easier, the same way auditing smart contracts is easier)
some interesting starts but not good enough (yet):
https://t.co/b1wlNfEtP3
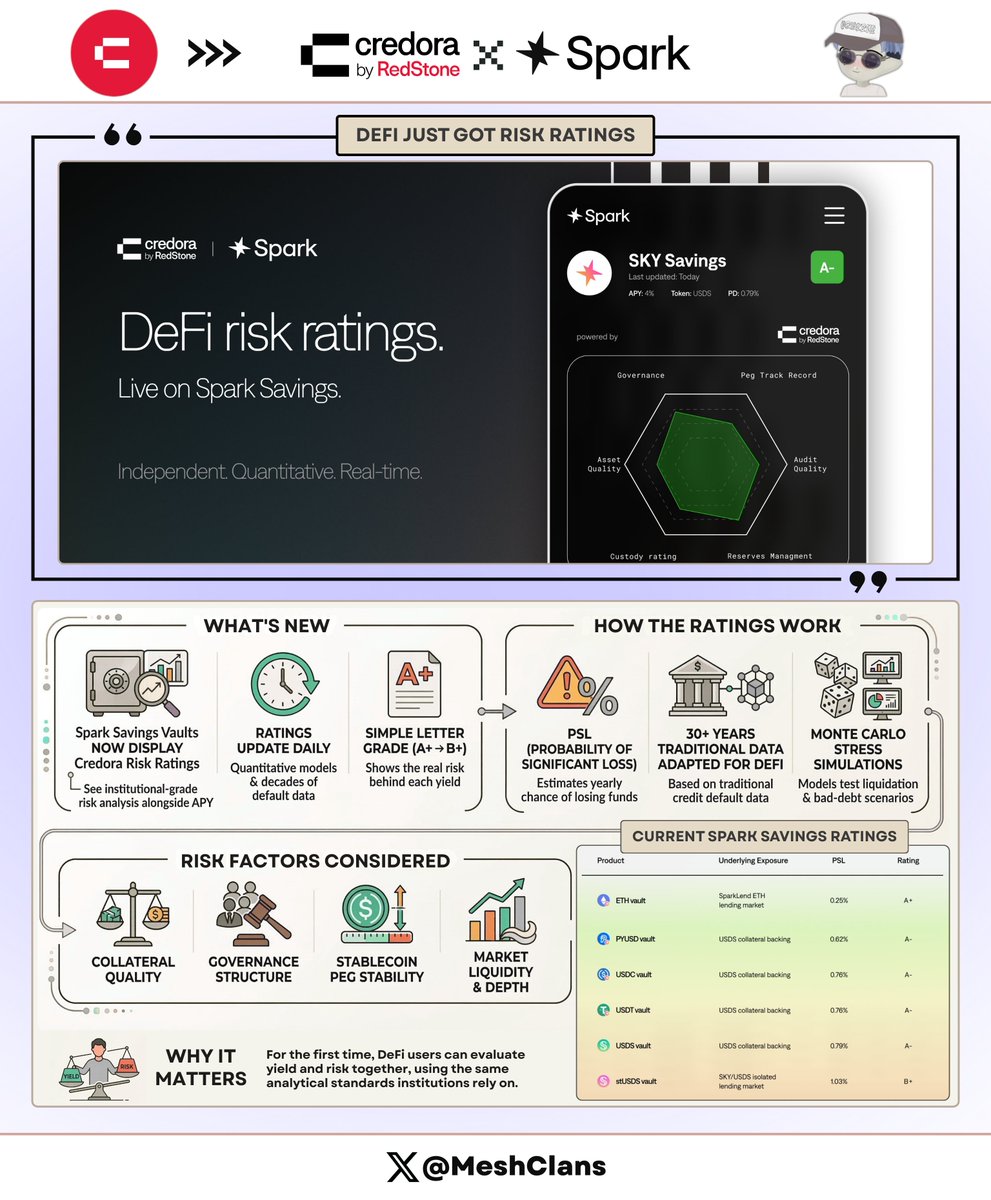
DeFi just got something it's never had before: actual risk ratings
Independent, daily-updated risk grades went live on @sparkfinance a few days ago, and every Spark Savings vault now shows a Credora rating based on quantitative models and decades of historical default data.
For the first time, you can see institutional-grade risk assessment right next to your APY.
Six Spark Savings products, each with its own Credora rating. A+, A, A-, B+ (one letter that tells you what you're actually risking to earn that yield, updated daily as market conditions shift).
Here's what the ratings show (per the current official report; check live in Spark Savings for any intraday shifts):
> Savings ETH → SparkLend ETH lending market → 0.25% PSL → A
> Savings PYUSD → USDS collateral backing → 0.58% PSL → A-
> Savings USDC → USDS collateral backing → 0.61% PSL → A-
> Savings USDT → USDS collateral backing → 0.60% PSL → A-
> Savings USDS → USDS collateral backing → 0.63% PSL → A-
> Staked USDS → SKY/USDS Aave lending market → 1.03% PSL → B+
This is risk-aware DeFi.
Every rating answers three questions: How safe is the collateral? What happens if prices move? Who's protecting your deposit?
The PSL (Probability of Significant Loss) gives you an annual percentage chance that you actually lose money, not just paper volatility. It's calibrated against 30+ years of credit default data from traditional markets, then adapted for DeFi's unique risk profile.
Behind each letter grade sits serious quantitative work. Monte Carlo simulations stress-test liquidation scenarios and bad debt risk under extreme price moves.
Risk modifiers adjust for collateral quality, governance structures, peg stability, and market depth.
The difference from traditional ratings:
> TradFi measures credit risk on issuers, Credora measures it on protocols and vaults
> TradFi updates ratings quarterly through committees, DeFi gets live updates pushed onchain
> TradFi relies on prospectuses and disclosures, DeFi reads onchain parameters directly
Savings ETH gets an A because of its conservative setup, deep liquidity, and battle-tested liquidator ecosystem. Staked USDS gets a B+ because there's high concentration in certain LTV bands, with $78M in positions against roughly $600K of liquidity at 2% depth. Higher yield, tighter liquidity cushions.
The rating just reflects that trade-off.
When risk is transparent, people trust it. When people trust it, capital flows.
IMO, this is how DeFi crosses the chasm.
Institutions don't deploy capital based on vibes and APY screenshots. They need quantified downside, stress-tested scenarios, and a risk framework that maps to existing mandates.
@CredoraNetwork built exactly that, and Spark is the first major protocol to surface it directly in the user experience.
As @hexonaut, co-founder of Spark, put it: "Until now, DeFi participants have had to piece together risk information from multiple sources, or worse, make decisions based on APY alone. Credora is the missing link!"
You can check it out yourself right now.
Head to spark(dot)fi/savings, open any vault, hit the Risk Assessment tab, and you'll see every rating, every underlying market, every modifier in real time.
Want the full picture? There's a 20-page institutional report with detailed breakdowns, collateral analysis, simulations, and complete methodology at reports(dot)credora(dot)io/spark/latest.pdf
The bigger picture here is Credora already rated 100+ vaults on Morpho, and early data shows rated vaults seeing faster TVL growth and stickier deposits. Sky/USDS integration is coming next, then wallets, fintech apps, maybe even AI agents routing based on risk-adjusted returns.
This isn't just Spark getting a feature upgrade. It's the infrastructure that lets DeFi absorb institutional capital at scale.
Note: Ratings update daily based on market conditions. Always check current ratings before deploying capital.
Quick disclaimer: ratings and data are informational only, not investment advice. Do your own research.
Know your risk.