@MikeZaccardi As of 2024, the United States stock market accounts for roughly 60% of the world's stock market. This is a significant share for a country that only accounts for a little over a quarter of the world's GDP
This chart vividly shows the pronounced overvaluation of US equities versus the rest of the world.
It's important to emphasize that price-to-book is just one metric for comparison; others like Buffett's total market cap of stocks to GDP and Shiller's CAPE ratio also reveal similar historical disparities worldwide.
Furthermore:
Notice that the rest of the world is currently as cheap as the US market was at the very bottom of the global financial crisis.
This prolonged underperformance is the result of several factors, including the dominance of American technology companies in the sector, chronic underinvestment in commodity-led economies and resource businesses, China's debt crisis, and various other factors.
So, what changes moving forward?
Looking ahead, we believe the post-pandemic era has reshaped markets and asset correlations.
Increasing deglobalization, persistent government spending, and a growing wage-price spiral are structural macro drivers paving the way for a potentially inflationary environment, attracting capital to undervalued sectors that have been overlooked for decades.
This resurgence underscores a return to value investing, stock selection, and fundamental analysis, fueled by sustained elevated cost of capital and the renewed significance of corporate margins.
Neglected segments of the market, including hard assets, commodity businesses, and resource-rich emerging markets, are poised to gain traction in this scenario.
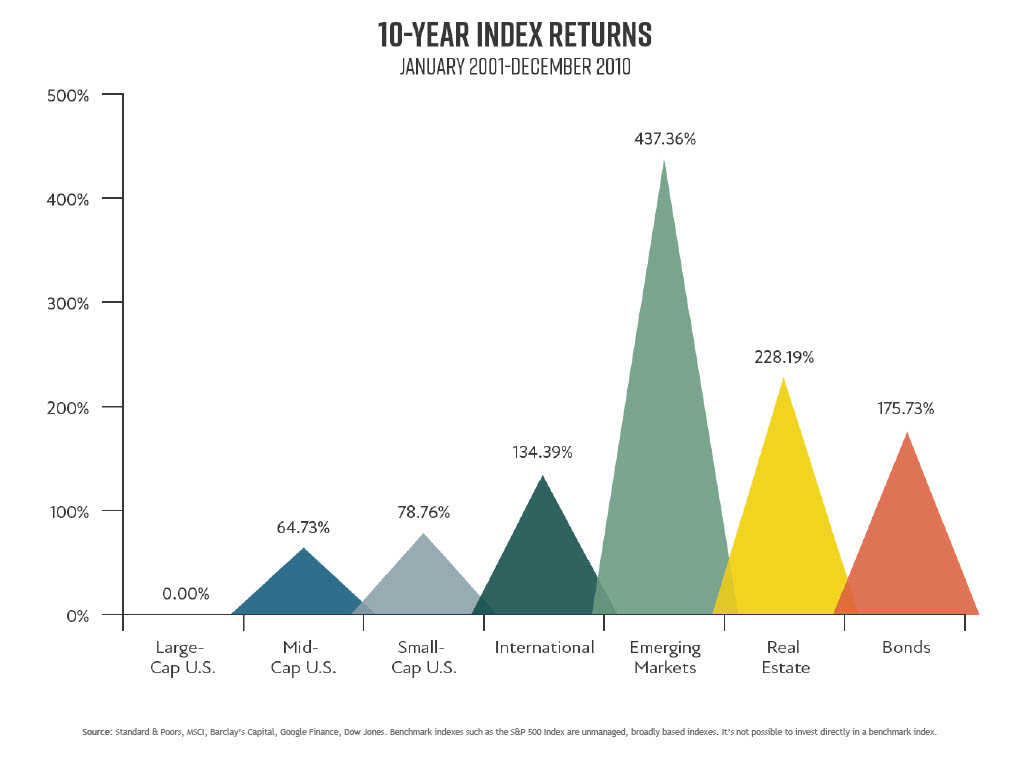
Why not just invest in the S&P 500? Because there's a cycle to everything, and nothing outperforms forever. From 2001 to 2010, large-cap U.S. stocks earned exactly 0% while many other asset classes did incredibly well.
From my new book: Money, Simplified. https://t.co/C5e02KziH4
Nvidia's market cap is now over $200 billion higher than all of the companies in the S&P 500 Energy sector ... combined. Meanwhile, the total net income of the Energy sector is $147 billion vs. $19 billion for Nvidia.
Video: https://t.co/QUIx0MG3nm
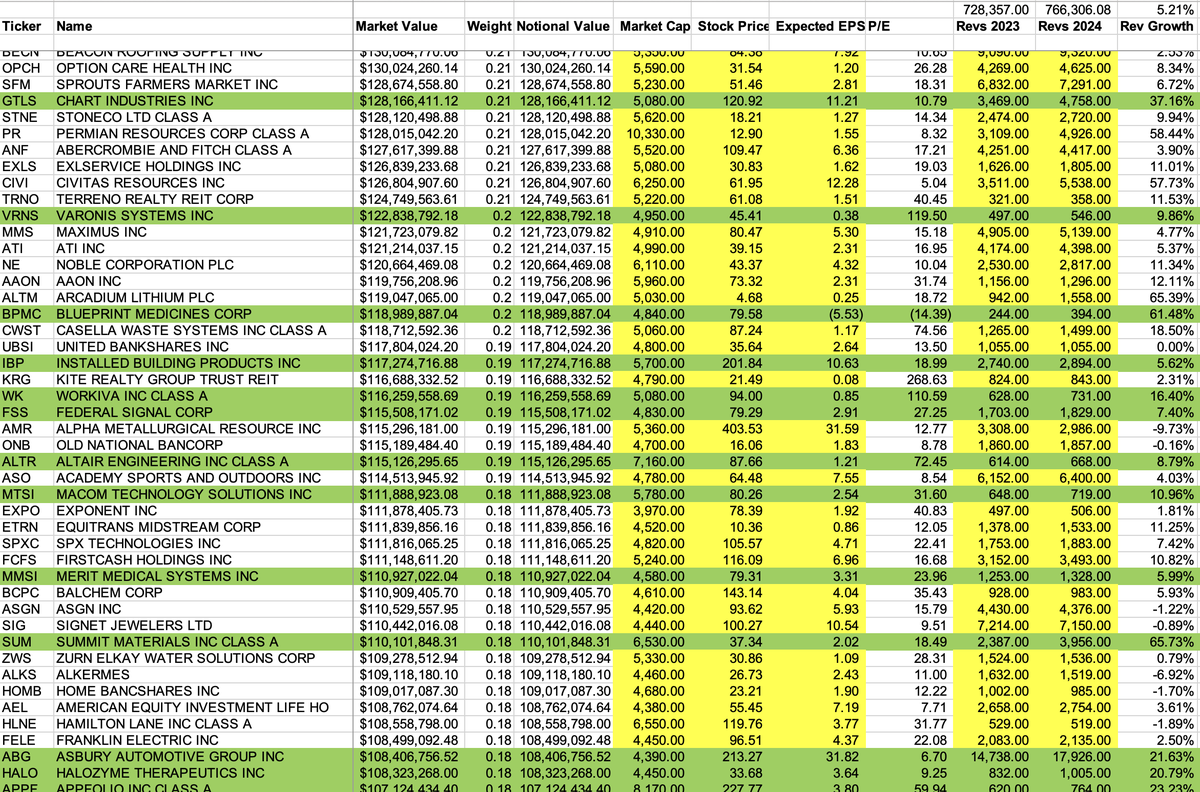
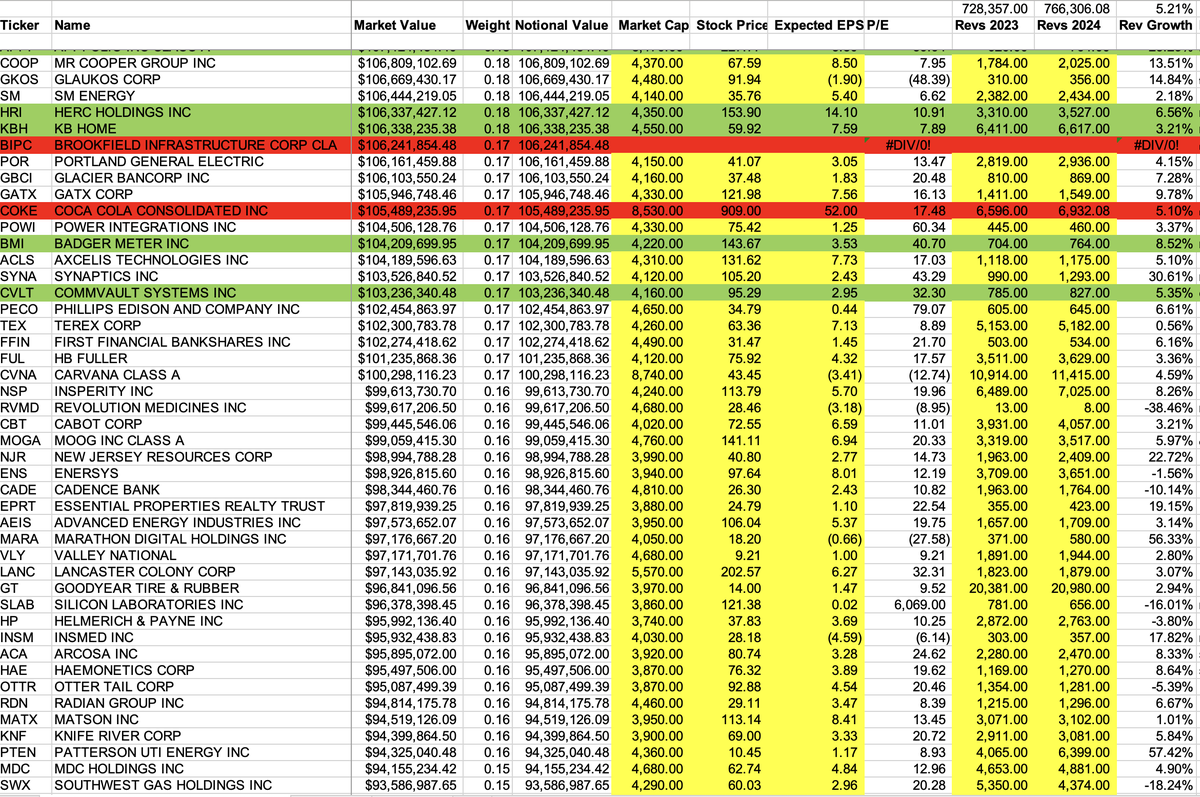
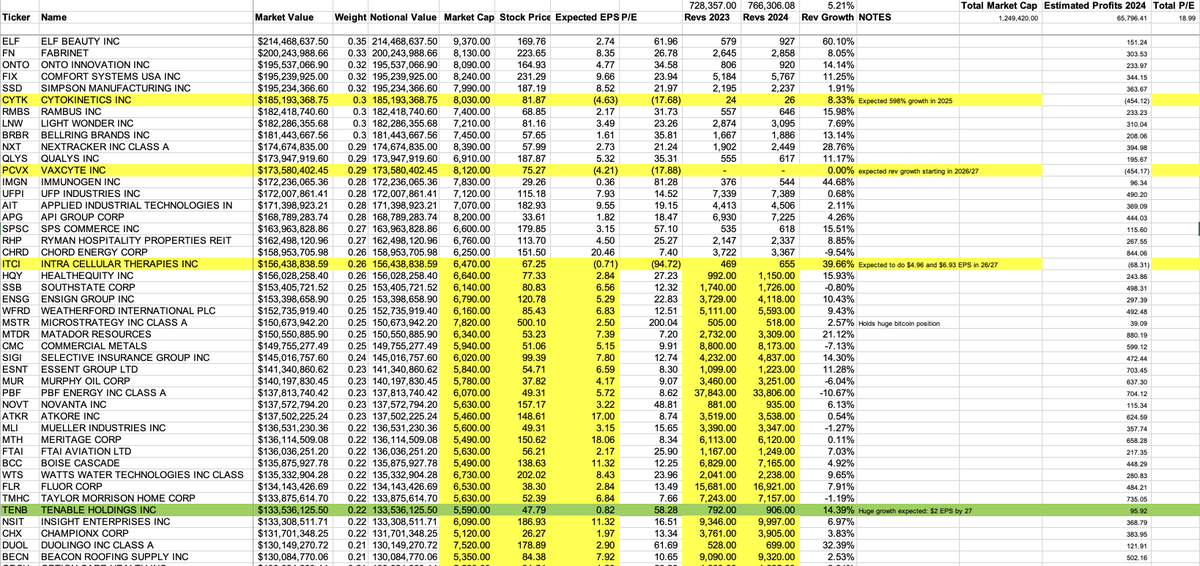
Have been going through all of the holdings in $IWM looking at some ideas.
"40% of Small Caps are Unprofitable"
I'm curious where this saying is coming from. I'm through 50% of the holdings and only 10% of them have a negative EPS for 2024.
"P/E is Low Because They Exclude Unprofitable Companies"
Another one I don't understand. I'm showing a PE of 18.9X after including the unprofitable companies, which compares to 22.2X for $SPY.
"SPY Companies are Growing Much Faster"
Expected rev growth rate is 5.2% for the $IWM holdings I've looked at in aggregate, which is slightly below the 5.5% expected for $SPY.
If anyone can point me to where I'm wrong, I'd appreciate it. Thanks in advance. @fundstrat etc
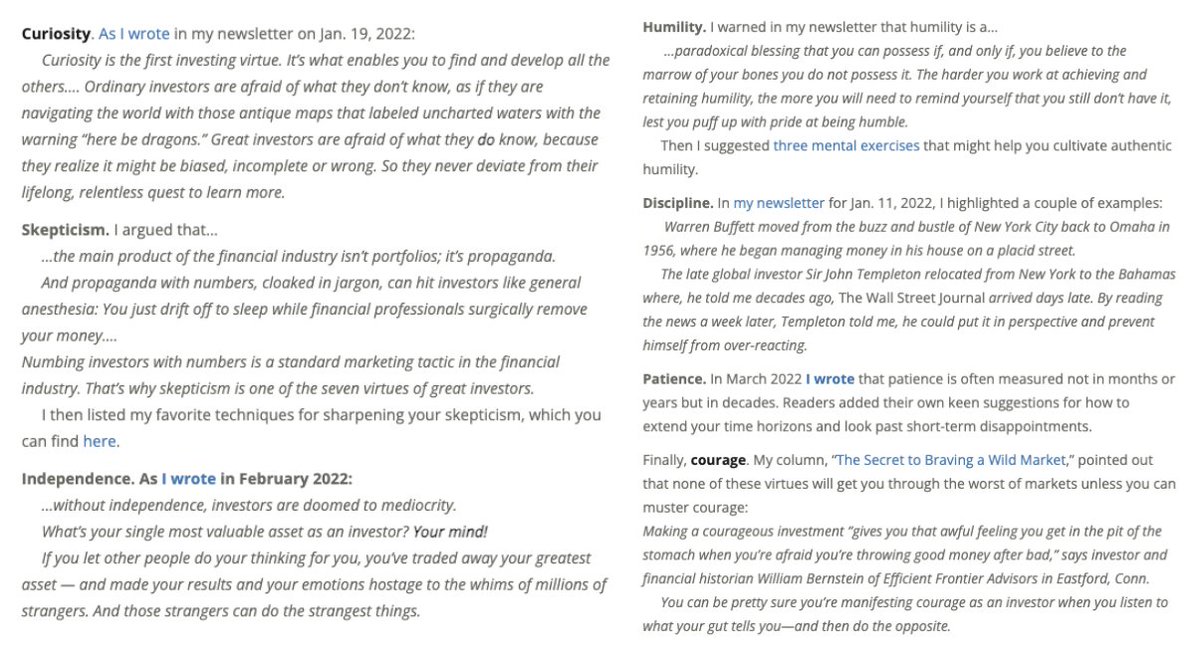
Mr @jasonzweigwsj penned an article in 2023 where he remarked that the "essential attributes that all great investors seem to share" are:
• Curiosity
• Skepticism
• Independence
• Humility
• Discipline
• Patience
• Courage
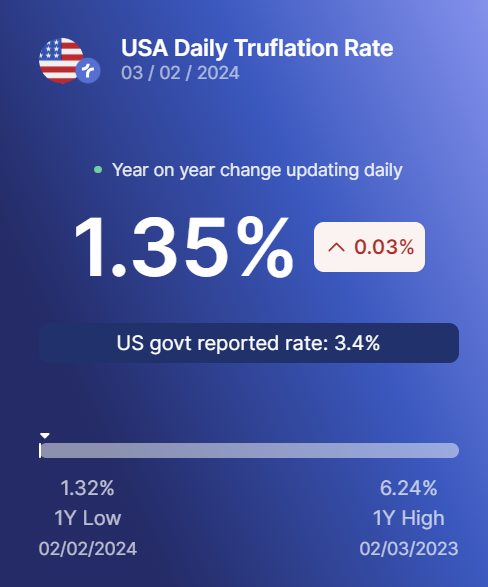
Truflation, which uses 18 million data points to see the real-time inflation, without the housing lag that the Fed has, now sees inflation of just 1.35%, down from 6.24% last year at this moment! 👀👀👀
“‘.. demand for electric vehicles does not look good ..,’ Generous government incentives are disappearing .. infrastructure and price still remain roadblocks .. In Germany, sales are set to drop 14% this year ..”
@business@JohnSpall247 $TSLA $GM $F
https://t.co/3KLhrXggQ0
GARZARELLI CAPITAL: As the Fed
eases, “we expect the Russell 2000 will be in a new bull market” — as small companies have already refinanced, cut inventories/headcount.
“In late 1994 when the Fed suggested their tightening was ending, $RUT gained 55.0 percent over the next 17 months.”
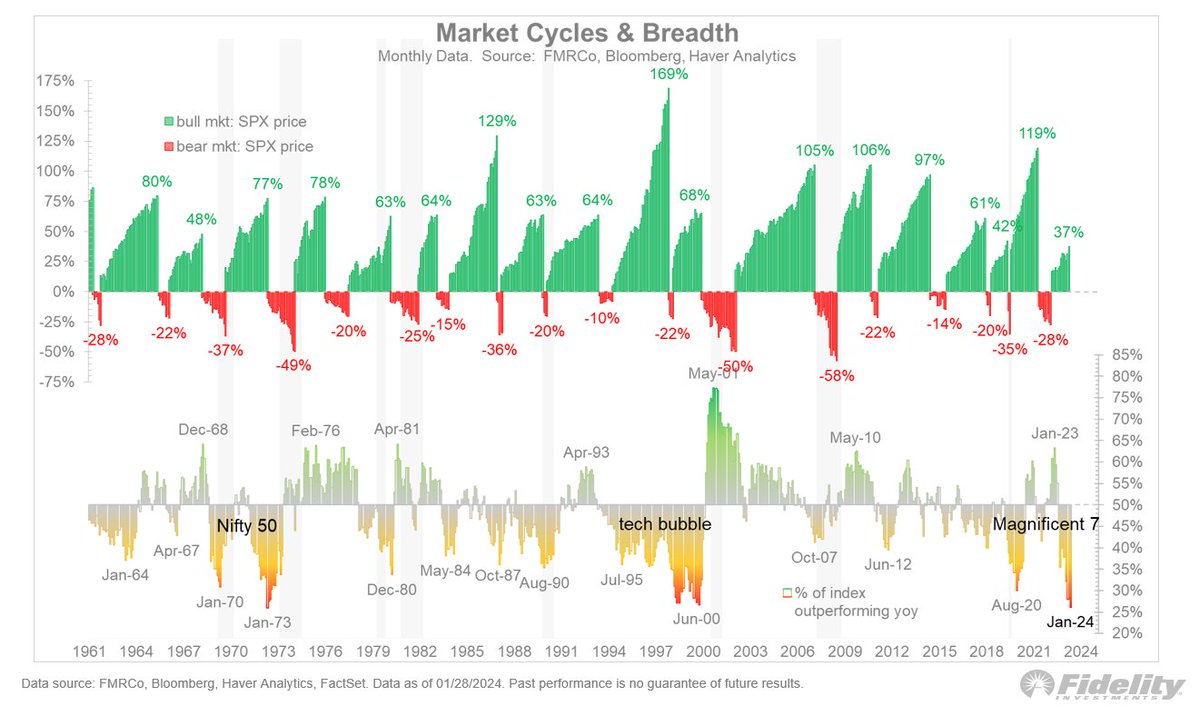
Even if the broader market catches up to the mega caps, that doesn’t tell us whether they will outperform. We are living in one of the narrowest markets in history, with only 26% of stocks outperforming the index. The last time this happened (1998-2000) it all ended in tears (down 53%), and the previous period (1970-73) led to a regime of valuation destruction (with the P/E ratio declining from 20x to 7x). These are not happy analogs to fish from.
This will blow your mind about market timing!
99% of what you hear about stocks is market timing: will the market go up or down? But that's noise. To demonstrate my point, here is a little story backed by evidence.
Imagine 5 investors. Each invests for two decades, allocating $2,000 annually, totaling $40,000 over 20 years. Here are the 5 different strategies they adopted:
1. Mr. Perfect Timing: He always invests the $2,000 perfectly at the 52-week low, every single year.
2. Ms. Lump-Sum Strategy: She invests immediately upon receiving the money.
3. Mrs. Dollar-Cost Averaging: She divides the $2,000 into 12 equal parts, investing at the start of every month.
4. Mr. Unfortunate Timing: He is so unlucky that he pours in the money at the peak of each year.
5. Ms. Safety First: She retains the money in Treasury Bonds.
The result after 20 years can be seen in the graph, 1 to 5 from left to right.
Despite the differences, being in the stock market outperforms any other option by a considerable margin.
Pouring it all in right away performs only 11% less after 20 years of investing versus a completely utopian scenario of investing at the very bottom each year. Dollar-cost averaging is a very close third, with a difference of just 0.46%.
Shocked?😳
Even our "Unfortunate Timer," who always entered at the market peak, got impressive results. 💪
This proves that if you're not in the stock market, you leave money on the table over the long run.
Maybe you think: "But now T-Bonds have a higher yield. This is just recency bias after the Great Financial Crisis!"
Wrong.
The study used 76 rolling 20-year periods beginning in 1926 (1926-1945, 1927-1946, and so on).
In 66 of the 76 periods, the rankings were exactly the same as in the chart.
A vital piece of this puzzle? None of these investors sold, amplifying the power of holding.
That's why the bad market timing still does so well. In reality, people often sell at the bottom and buy again closer to the top.
If you're a long-term investor, remember that obsessing over market timing is futile. The real danger lurks in staying cash-heavy for extended periods, setting the stage for underwhelming performance.
In conclusion, the best strategy is simpler than you think:
JUST
STAY
INVESTED
Embrace the market's ups📈and downs 📉, and given the right horizon, your investments will do well.
In short:
Invest
Hold
Result? Guaranteed.
P.S. if you find this insightful, feel free to repost. ♻