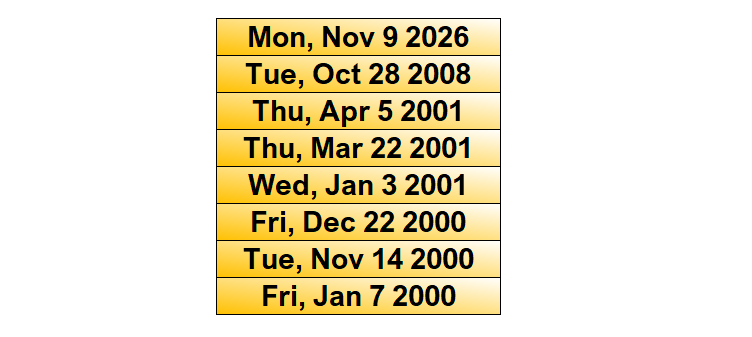
First, allow me to give you the list of dates that today just joined.
Go on, take a few seconds to pick out a favorite.
Then I'll tell you what the criteria were.
On @WilfredFrost podcast on Tuesday, I said I was “terrified of what happens on the other side of mid-terms.” Post election, 40%+ of incremental datacenter capacity is now at risk. For the wk, SOX/SPX/Nas -12.1%/-2.7/-3.4%. The good news is oil prices should continue to come down.
Comments by the AI industry that included: 1) AI could wipe out 50% of entry-level white-collar jobs within the next one to five years and 2) AI having a 10% probability of wiping out humanity, justifies the public backlash against datacenters.
My belief remains that those AI related companies that have other lines of business supporting their investments in AI will be the ultimate winners. I see the neo-clouds and pure LLM labs like Anthropic and OpenAI being in an even worse position post mid-terms. But the existing capacity at the big hyperscalers has become more valuable and they are likely to face less competition from the neo-clouds. Due to the regulatory friction and moderation of semiconductor price increases, hyperscaler capex spend in 2027 is also likely to be less which should help their cash flows.
The big 3 public cloud hyperscalers all gained last week: $AMZN +7.9% (they also benefit from lower oil prices), $GOOGL +1.8%, $MSFT +1.7%. But the coast is not all clear given growth rates at AWS, Azure and GCP are likely to be negatively impacted at the start of 2027 by this regulatory friction.
$META lost only 0.8% last week. They do not have a public cloud but 1) social media is not likely to get disintermediated by AI, 2) Muse has been a hit in Agentic AI and 3) AI is helping the monetization of their ad business.
As for semiconductors, the SOX was down 12.1% last week. Physical space in datacenters to put these chips was already an issue before the mid-terms. It is worse now. Even on Wednesday when the S&P was up 1.6%, the SOX was down 3.1% with an even bigger 12.2% decline on Thursday when the S&P fell 4.4%.
This brings me to my point that good portfolio risk management is critical, especially around AI related stocks. This is true even if bullish due to the nascent nature of Agentic AI (my view) because one of these times, if not already on 6/22, will be THE TOP. That is why I warned of an AI “speed bump” on 6/20 and posted on 10/4 “Finally, the current bi-partisan (amazing they agree on anything) pushback on datacenters could get worse after November 3rd mid-terms if there is a blue wave which is what the current polling data leans towards.”
This year, from its all-time peak on 6/22 to the Situational Awareness driven low on 7/29, the SOX declined 29%. It then rallied 27% before the recent 32% decline from 10/6-11/5. These recent declines are also close to the 8 average declines of 34% during the dotcom bust. The SOX is now down 36% from its all-time highs with 14 of its 30 constituents down 50%+. But even during the dotcom meltdown over 2 ½ years, the SOX had 7 rallies that averaged 28% while losing 83% from peak to trough.
The good news is I think oil prices are likely to head much lower by year-end now that mid-terms are over. An excerpt of Iran’s response by the Speaker of their Parliament was “Conscience or the cost of living, Americans said NO TO WAR, and we endorse this message.” As a reminder, the Iran hostages after being held for 444 days were released just minutes after Ronald Reagan was inaugurated This followed his crushing defeat of President Jimmy Carter. I think a deal with Iran is coming soon.
Given my view on oil, I believe we will see the usual seasonal strength in the non-AI side of the stock market through year-end. Five of the eleven sub-sectors of the S&P that are not as closely related to AI or energy were up over 1% last week: consumer staples, consumer discretionary, financials, real estate, and telecom services.
In summary, I think those sectors that would benefit from lower oil prices should perform well through year-end. As for AI, related stocks reached their most oversold levels on Thursday since the tariff lows in April of 2025 before bouncing on Friday. But unfortunately, my S&P quant model had only 25% of my technical metrics indicating that Thursday was a short-term bottom vs the average of ~50%. The anemic 0.3% S&P advance on Friday following the 4.4% decline on Thursday also is not encouraging looking back at historical data. Therefore, stock selection, daily risk management and seeing how the market reacts to incoming data will remain key given these conflicting factors.
Best of luck in what is likely to be a volatile environment through year-end.
Pretty solid: On the 12 previous days when the QQQ/LQD RSI(14) was at or below 25.5, QQQ was higher one week later in 11 cases (92%). It was higher after both 9 and 12 months in all 12 cases.
Small sample, with some overlapping observations.
LQD is the "iShares iBoxx $ Investment Grade Corporate Bond ETF"
While Brent crude prices have stabilized and futures backwardation remained well entrenched, Dated Brent prices are now below prompt Brent futures and the front half of the Brent CFD curve is in contango.
Physical market says we're currently balanced-to-slightly oversupplied.
The $VIX just surged over 70% in a single day. Everybody is scared. So let me explain what this actually means because most people have no idea.
The VIX is basically the price of insurance on the stock market. When it spikes like this, it's not because the economy broke overnight. It's because everybody rushed to buy protection at the same time. Funds buying puts, people hedging, leveraged traders getting forced out. Fear gets priced in all at once.
I went back and pulled every time the VIX has surged 70% or more in a single day since 1990. Today is only the 6th time ever.
February 2007. The China selloff. S&P was up 1.3% a month later and 8.5% three months later.
August 2015. China devalued its currency and the market flash crashed at the open. The S&P was back above where it started in 3 trading days. Up 2.4% a month later and 15.5% a year later.
February 2018. Volmageddon. The VIX more than doubled and products that bet against volatility blew up overnight. S&P was up 2.9% a month later and 7.6% six months later.
August 2024. The yen carry trade unwind. The VIX ripped 181% intraday and everyone was screaming recession. The S&P never went lower. Up 6.4% a month later and 22% a year later.
December 2024. The Fed spooked everybody on rate cuts. S&P was up 3.6% a month later and 17% a year later.
One month later the S&P was higher all 5 times. Six months later, higher all 5 times. Not one of them turned into a crash. The worst it dropped after any of them was 6%.
Why does this keep happening? Because once everybody's already bought their protection, there's nobody left to panic. When the fear starts fading, all those hedges get sold, the VIX comes down and the market gets pushed right back up. The spike is usually the climax, not the beginning.
Does it have to work this time? No. It can chop around first, it did in a couple of these. But this is not where history says you panic.
— Obnoxious Wolf Jonesy
$SPX $SPY #SP500 $ES_F $QQQ $NDX $CL_F #US10Y $TLT
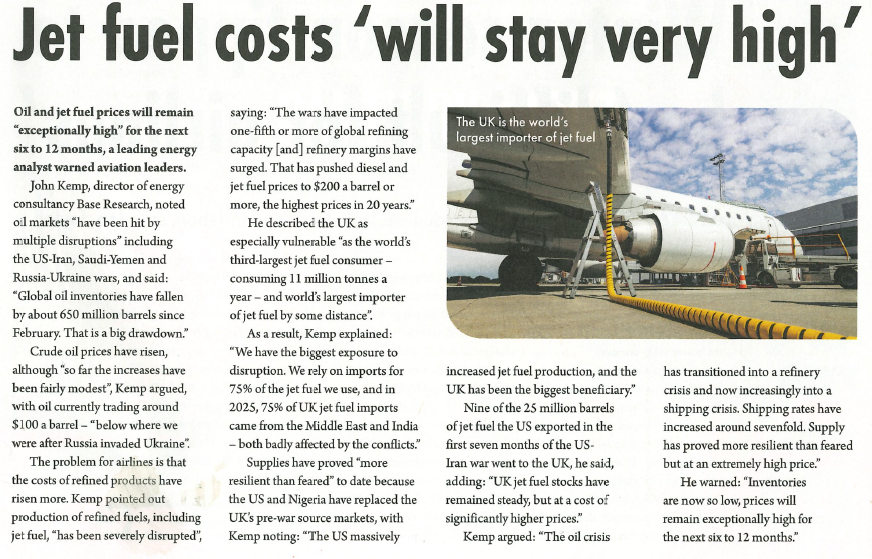
JET FUEL costs will remain very high for at least next 6-12 months - some thoughts from me at a conference on UK aviation for @AirportsUKNews last month in @travelweekly
@BillPilgrim18 Trump wanted a deal bc that would've brought nrg prices down. Iran didn't for the same reason. Iran has borne massive pain to keep nrg prices elevated. After the midterms, what's the point?
During my five decades of trading covering six different decades and nine of the 46 presidents, I have increasingly come to the conclusion that "fear of being stopped out of a trade prematurely" is a significant contributor to trading failure
@neilsethinew Yes I believe you're correct. IDK why I said he's a big bear. I've seen him say in the recent past that he expects them to trade in a range; I forget the range but it may have been 4.5-5.
Octoberphobia giving way to a year-end rally? The Halloween Trade and post-midterm election rally have historically aligned with a bullish stretch for stocks. Here's how 2026 is shaping up. https://t.co/iak6aWEQBp
Continued historic flows into cash.
Yes, you can finally get something for cash, but this feels extreme.
Past surges have been opportunities. Is this time different?
Nice one from @MacroCharts in his must read report today.
Unlike the dot-com bubble, when global technology stocks surged far ahead of earnings, the current rally has been supported by stronger earnings growth.
Source: @steve_donze
I mentioned in the Week Ahead two weeks ago regarding the McClellan Summation Index that “when it does rebound, rallies in the NYSE Composite are generally fairly powerful.”
I wanted more granular detail, so I ran it through Claude:
The Index bottomed near −1,190 on Oct 8, its deepest reading since October 2023, though well short of the 2018, 2020 and 2022 washouts.
What stands out is how little price damage came with it. The NYSE Composite fell just 5.4% from its Aug 14 high, the smallest drop of the 13 sub-zero breadth washouts since 2018.
History is supportive, with caveats. After the seven prior turns from below −1,000, the NYSE was higher three and six months later in six of seven cases, with a median gain of 12.4% at both points.
But three of those seven, in October 2018 and twice in 2022, were followed by a lower price low within six months.
A turn in breadth hasn’t always marked the bottom in price. Across all 12 prior sub-zero turns, the NYSE was higher a month later 11 times. But 11 sessions in, this rebound is one of the softest.
The NYSE is up 1.3% since the Oct 8 turn, against a median of 4.9% at the same point after prior turns. The Summation Index has climbed about 475 points to −711, against a median of roughly 1,290. Only two prior turns started slower on price, October 2018 and June 2022, and both were followed by lower price lows. That said, this washout came with the least price damage of the 13 turns, so there was less ground to make up.
Historically, you tend to see late October major lows in midterm years.
Fear is spiking in major ways. Huge jumps in put volume on Friday. $SPY 3rd highest put volume ever and $QQQ 2nd most ever.
The CNN Fear & Greed Index (blue line) plummeted to 17.9 Friday, the least since April 1st, from 45.0 a week ago, falling into “Extreme Fear”.
All seven indicators are below Neutral with six in Extreme Fear.
Extreme Greed = None
Greed = None
Neutral = None
Fear = junk bond demand (vs investment grade) (from Extreme Greed)
Extreme Fear = market momentum (SPX vs 125-DMA) (from Greed); stock price strength (net new 52-week highs); stock price breadth (McClellan Volume Summation Index); put/call options (5-day put/call ratio) (from Fear); market volatility (VIX & its 50-DMA) (from Neutral); safe haven demand (20-day difference in stock/bond returns) (from Greed)