There were 18 named storms in the last Atlantic hurricane season, which ran from June 1 to Nov. 30. Five reached major hurricane strength: Beryl, Helene, Kirk, Milton, and Rafael.
Our colleagues at @noaa predict an above-normal 2025 Atlantic hurricane season.
🌲 #Forests🌲 Editor's Choice #Article
📢 "Terrestrial #Laser#Scanning for Estimating the #Volume and #Biomass of Coniferous #Stems in the Mariposa Monarca Biosphere Reserve, Mexico" written by José Antonio Hernández-Moreno.
👉 https://t.co/r17hFA0kS4
We are adding some 110TB of analysis-ready data to https://t.co/ujKqq5ITQf (all cloud-optimized as COGs or PMTiles). The upgraded system includes dynamic soil properties "Soil Health Data Cube" part of the @AI4SoilHealth and @EarthMonitorOrg projects, bimonthly time-series of biophysical indices (https://t.co/aWKjjkEg6T), including the vegetation height annual (https://t.co/u46wVCJzU1) and #soilcarbon density predictions (https://t.co/lPaBRFT9Qe).
We are focusing on preparing high resolution (10-30 m) data for 2000-2024 so that you can run various time of time-series analysis and monitor changes across pan-EU.
We have also added the field boundaries for pan-EU (https://t.co/O3E0UTNHW0) and number of vector layers using PMTiles format. See if you can locate actual fields and visualize long-term trends.
All data is available as open data via STAC (https://t.co/LSvxMoGhw2), which means you should be able to develop computational notebooks (see some examples here: https://t.co/UbtJUG46bx) even on your laptop (assuming you only need to analyze local data).
Next mission: add all major pan-EU data sets from the EU Environmental Agency and the Copernicus Land Monitoring Services and further integrate data so analysis becomes even more seamless. Next major release is planned for September 2025 and should include monthly products and data updated up to 2024.
Many thanks to @GilabRs for the front-end implementation and all other partners on the EU Science, Research and Innovation projects @EarthMonitorOrg and @AI4SoilHealth
CHOIR is now online @NatureGenet! CHOIR is a new clustering method for single-cell data that evaluates whether clusters represent statistically distinct cell populations. CHOIR scales to millions of cells and works with single-/multi-omic data of any type!
https://t.co/EKg20yMygH
🌍🌡️ Droughts could last on average 10 days longer than previously predicted by 2100. By improving climate model accuracy, we can better prepare for & reduce the impacts of prolonged dry spells through #AnticipatoryAction.
Investigate further ➡️ https://t.co/bPHmK39iPw #AfRP9
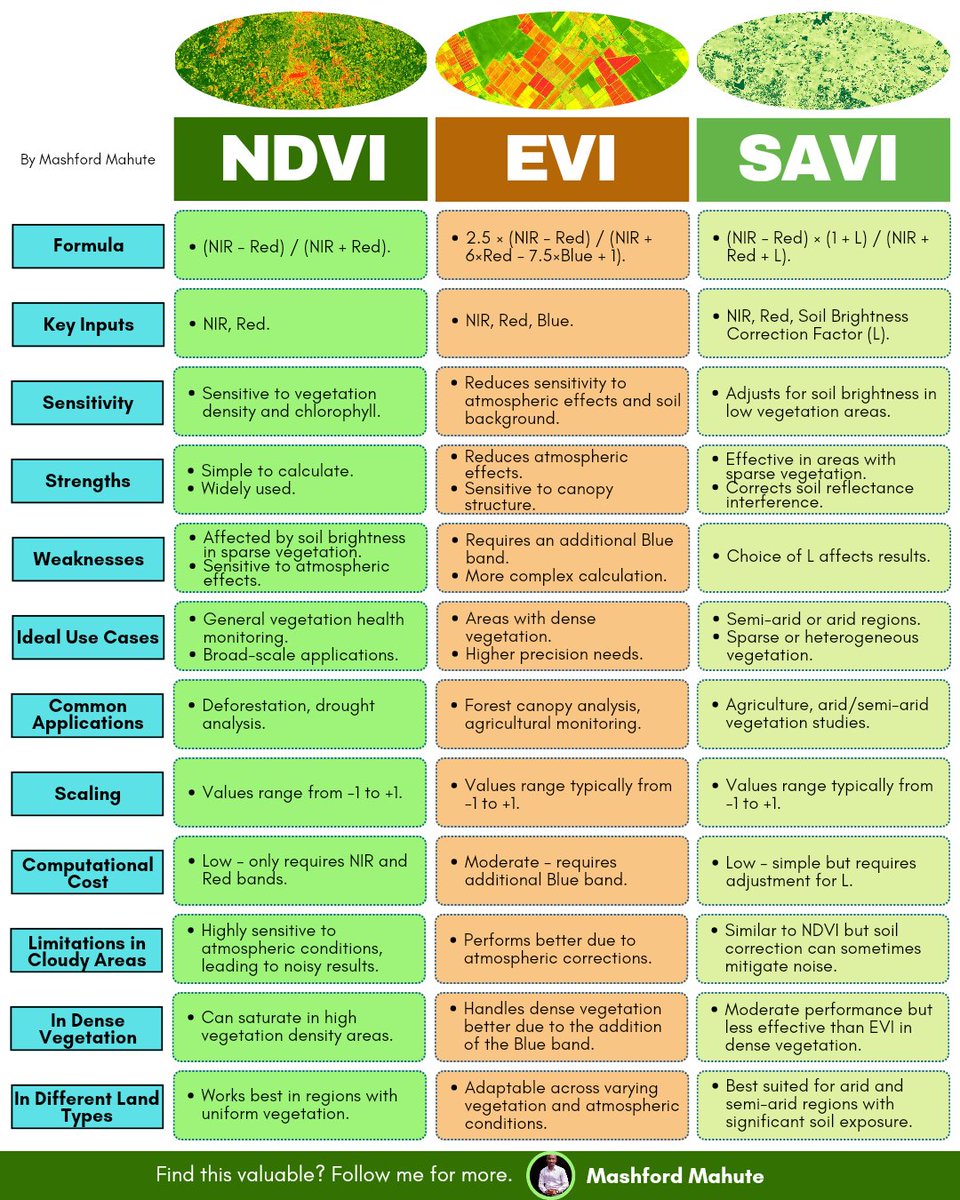
Vegetation indices are powerful tools in remote sensing, offering insights into vegetation health, density, and distribution.
Here's an infographic comparing the main indices — NDVI, EVI and the SAVI.
#GIS#RemoteSensing#Geospatial#QGIS#ArcGIS#DataViz
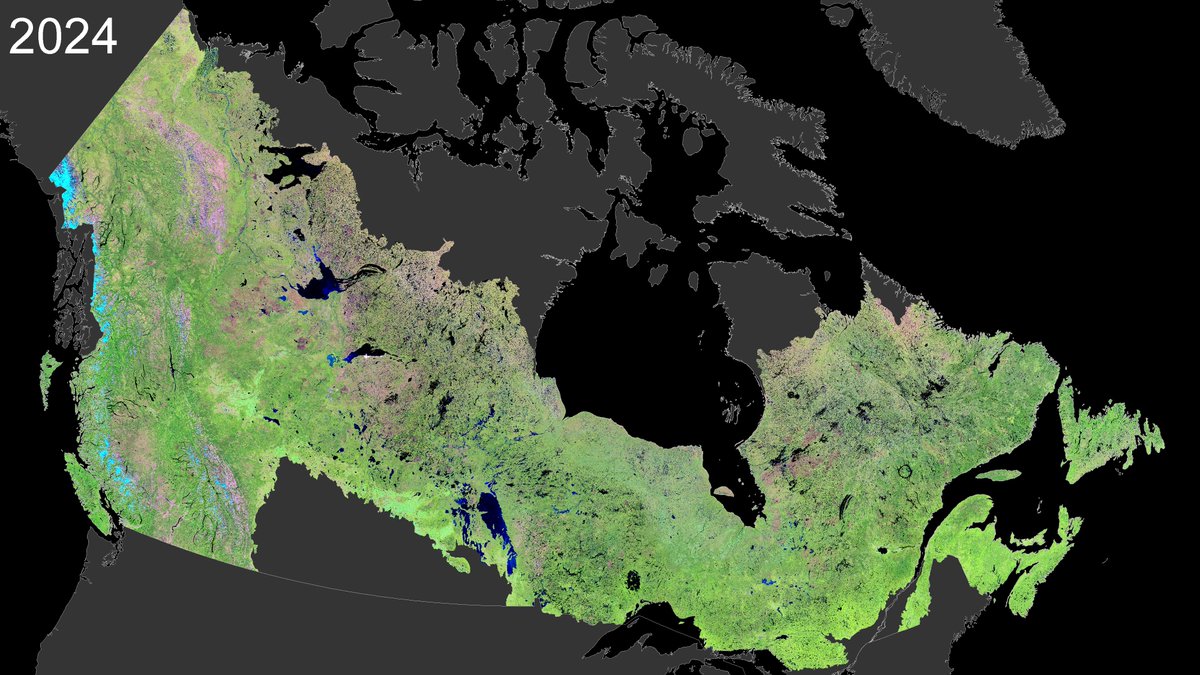
2024 mid-summer image composite of Canada's forests.🌲
Updating compositing methods and data sources. Now using 1000s of images per year of #opendata from Harmonized #Landsat#Sentinel2 (HLS). 30 m.
Data is key input to National Terrestrial Ecosystem Monitoring System (#NTEMS).🇨🇦
NASA's HLS project has released new vegetation indices with 30m spatial resolution, enhancing global monitoring for agricultural and other vegetation-focused applications.
Dive into the data: https://t.co/RY9UhExLdH
#Vegetation#Agriculture#Nasa
🌳🌲 Individual- #Tree Segmentation from #UAV– #LiDAR Data Using a Region-Growing #Segmentation and Supervoxel-Weighted Fuzzy Clustering Approach
✍️ Yuwen Fu et al.
🔗 https://t.co/yv3C0DswQx
#Wetlands are vital habitats, pollution filters, carbon sinks, & much more. Over half the world relies on wetlands for food, livelihoods, & clean water.
via @BlueCarbonLab
2024 broke records for extreme weather– heatwaves, droughts, storms, & floods killed thousands & displacing millions. World Weather Attribution & @ClimateCentral show these were intensified by human-induced climate change.
Learn more ➡️ https://t.co/CYkx7KUP1E
via @UNDRR
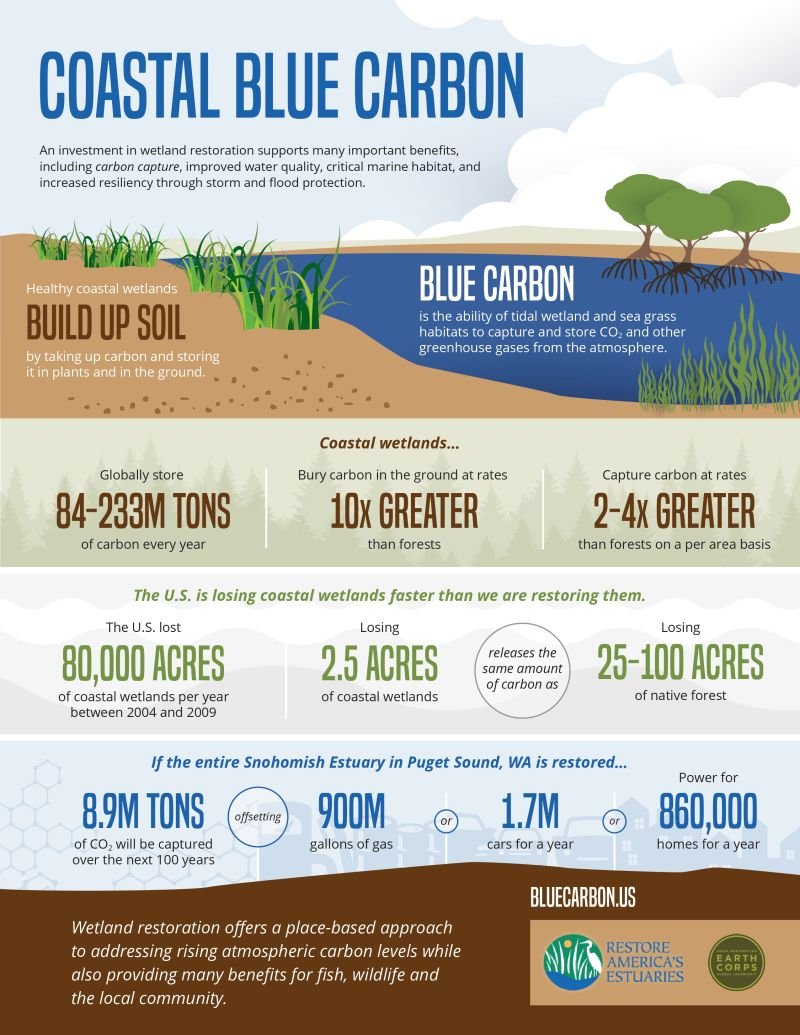
"Blue Carbon is the carbon sequestered by coastal marine ecosystems. Coastal seagrasses and wetlands remove carbon from the atmosphere and help to combat climate change." 🌏
Learn more 👇
via @RAEstuaries & @EarthCorps
The WORLD #DROUGHT ATLAS is out! Please check below for a very comprehensive overview of the world of drought and learn how drought manifests, is felt and dealt with around the world.
¿Cuánta presión a los límites planetarios ejerce el grupo de personas de mayor consumo?
En paralelo a la #COP29, @Nature publica una investigación clave: hasta el 91% de las violaciones de los límites planetarios se puede atribuir al 20% de consumidores mundiales más rico.🧵👇
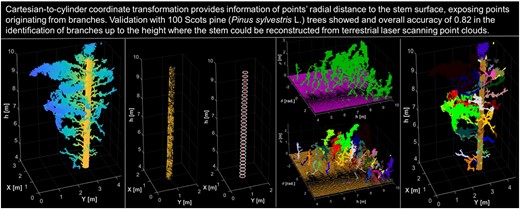
Assessing tree architecture using terrestrial laser scanning 🌲
@TuomasYrttimaa et al. developed a point cloud processing method for identifying and segmenting branches of Scots pine trees which can be useful for assessments on biomass or wood quality.
🔗https://t.co/yYv63Y6c2i
📢🛰️🌳Forest degradation & tree cover loss in the tropics can now be seen w/ high resolution & attributions based on #ArtificialIntelligence and Planet @NICFISatData 5m satellite data
🪵🔥🛣️Available for viz at REDD+AI platform: https://t.co/bjErBgt8Ps
@CTrees_org@FabienWagner