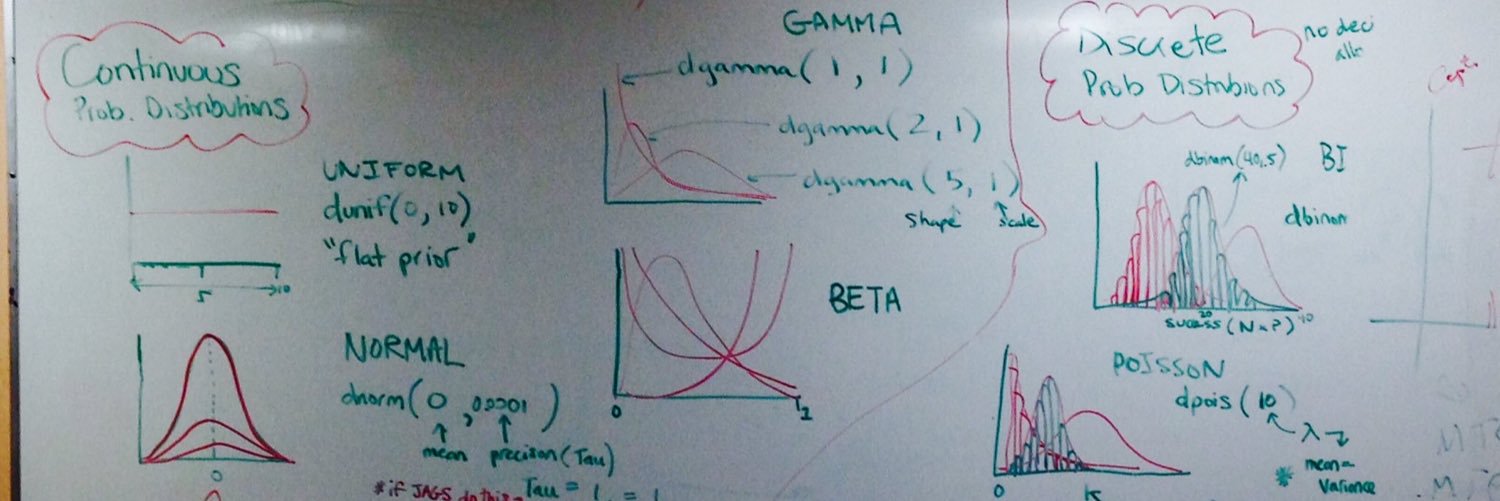
This is an informal get-together of SFU ecologists and statisticians to bounce around ideas on graphing, coding and statistics; from ANOVAs to Z-scores.
I was recently asked to give a stats talk in my department on how to analyse zero-inflated count data, which is a common problem in ecology (and especially behavioural ecology). I came up with this flowchart and thought I'd share it in case it's useful for any of you #rstats
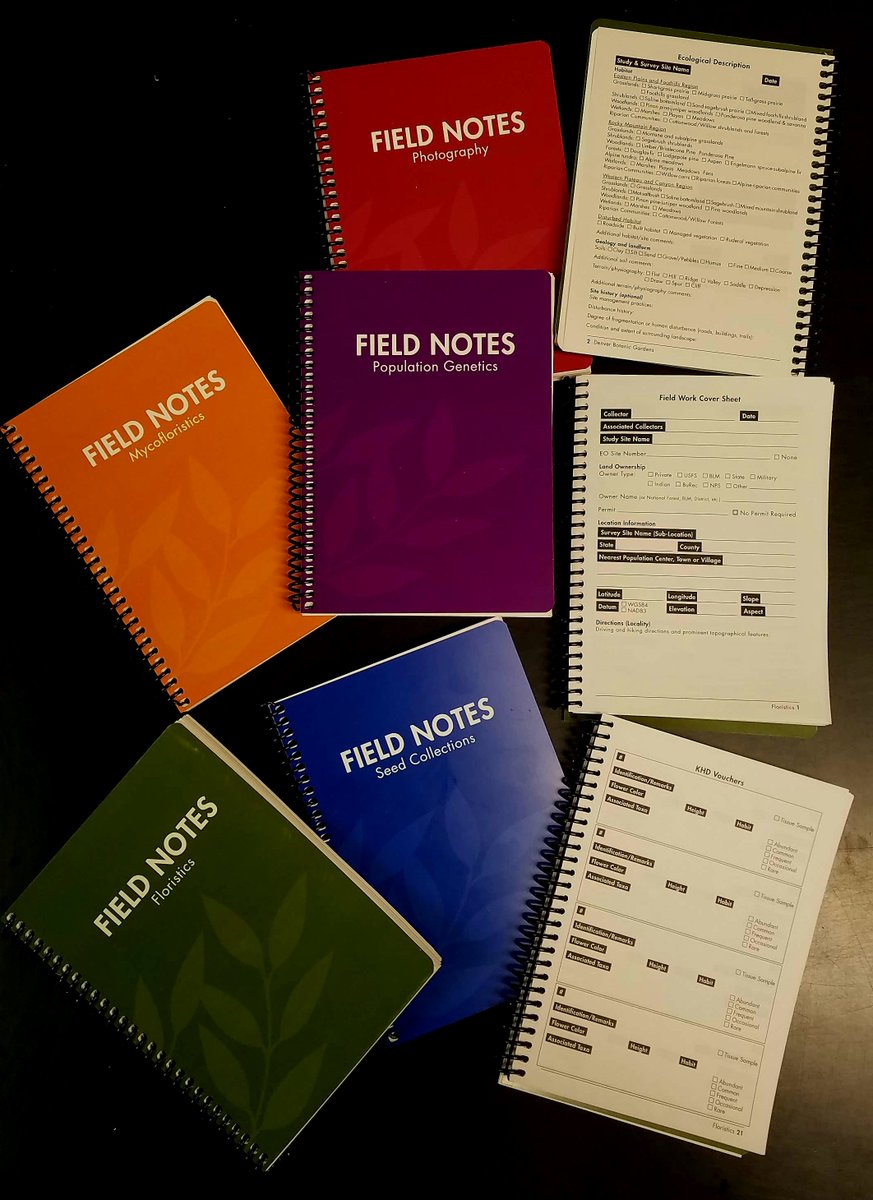
In effort to standardize data, add ecological context to specimens, & bring consistency across projects, @botanic made custom field books for 2018 season. Complete w/ pages for ecological site descriptions, all terms are defined in partnering #metadata dictionary @SpnhcTdwgNZ
How to start contributing to #rstats packages? Here’s a great write-up of why and how @dobbleobble worked with maintainer @ma_salmon to add functionality to monkeylearn. https://t.co/DEhAcUL7Fb
Do you want your #Research to last longer and have a broader reach? Make it easier to include in a #MetaAnalysis! @GerstnerK explains how to do just that: https://t.co/hK1rz7rmHf
This article was shortlisted for the 2017 #RobertMayPrize
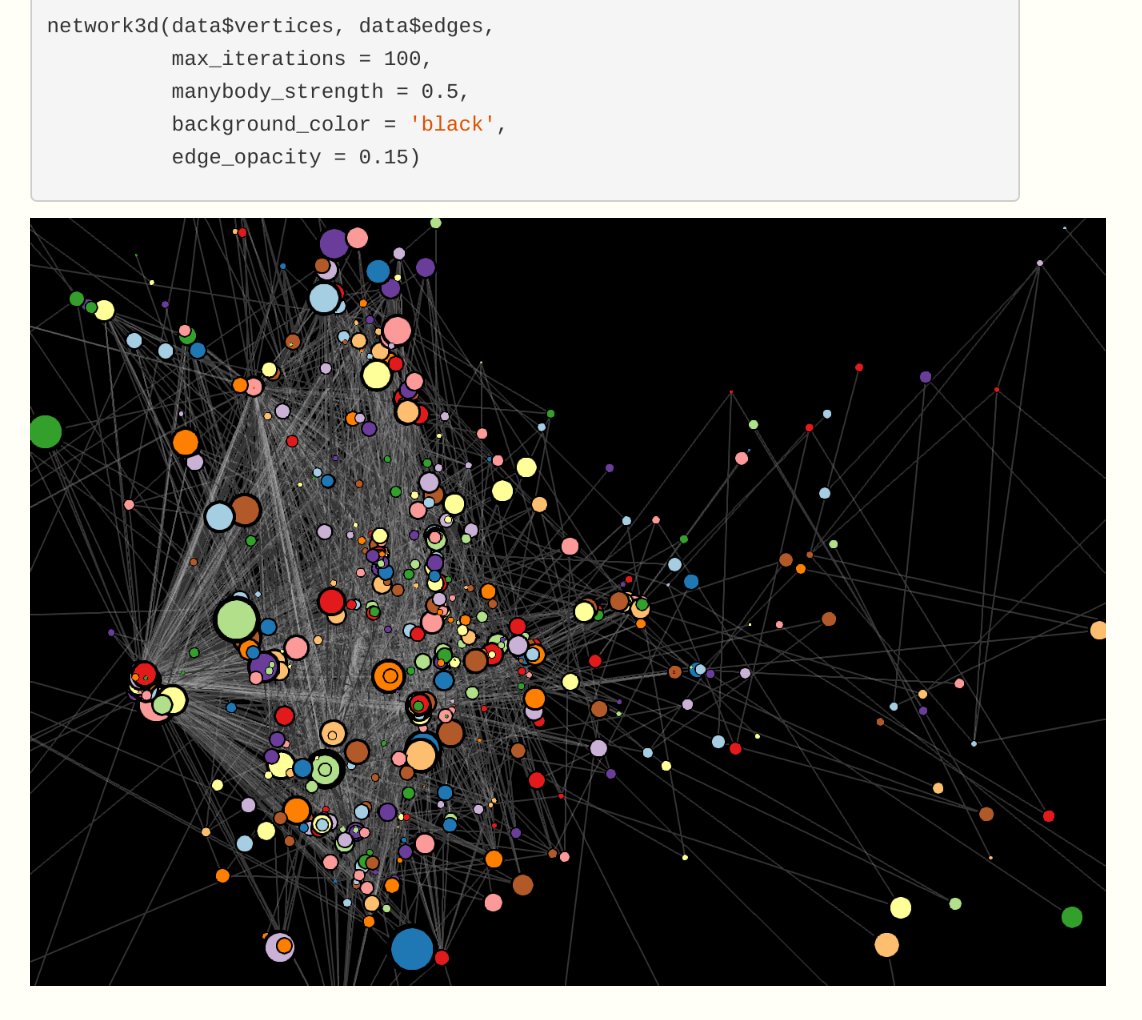
Finally got around to writing up a tutorial for my new #rstats 3d network #Datavisualization & layout library: network3d. Uses #javascript to display and calculate layouts for large networks interactively. The only dependency is htmlwidgets. Try it out! https://t.co/PjKkwe84EO
What are the key classic papers of science that grad students of many fields should read?
To start off, how about:
Hurlbert (1984) Pseudoreplication
Hardin (1968) Tragedy of commons
Chamberlin (1965) multiple working hypotheses
Want to improve your data viz skills? Check out this awesome series of one pagers on best practices to get effectively tell a story with your data https://t.co/9Mwbz5WjAM thanks for the awesome workshop @MKrzywinski
OK twitter, what's your opinions on the PCA-axis-as-new-variable approach? ie
1. Collect many correlated variables
2. do PCA
3. interpret the first few axes as being about something specific
4. use those axes in a multiple regression
#rstats#ecology