תוכנית ליפקין-שחק במכון למחקרי ביטחון לאומי וקהילת Machine & Deep Learning Israel מזמינים את הציבור הרחב לכנס מקוון על מיזמים מבוססי דאטה שפותחו בתקופת הקורונה, והשלכות השימוש בדאטה על ההתמודדות עם המגפה.
1/7 We formulated a strategy to get us out of COVID19 with minimal damage. The formal paper will be on ARXIVE, code on Github soon. Meanwhile read about it here:
https://t.co/wrLXy5TLPK
Lets talk about its main components in the tweets to come. Please help us spread it: RETWEET
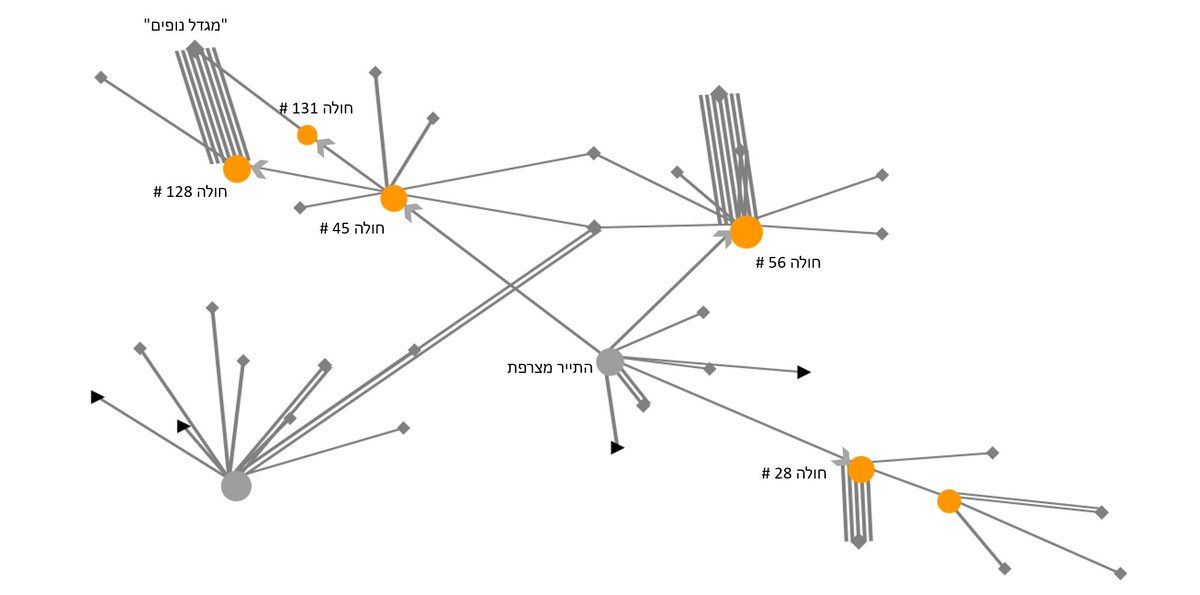
In this exceptional moment of need, we decided to turn the BarabasiLab's network medicine toolset to aid the hunt for a treatment for COVID-19. We will also forgo the usual guardedness of research, and post the results, as the arrive, here: https://t.co/HmzP1JfxWH.
Visualizing multi-spectral satellite images is more an art than a science. @idan_barak, our VP product, talks in #isvis2019 (Hebrew).
https://t.co/NG3nwvAqzC
@CopernicusEU@openlayers
@mouthofmorrison 3. Completeness. ESRI's stack is complete. Open source is yet to come with an e2e suite. Integrating all layers (DB, server, client, gis calc) still requires the labor of software engineers- which only gets more expensive and tends towards over-engineering and creeping-featurism)
@mouthofmorrison 2. Government/monicipal procurement rythm. In the Israeli case it usually means 3-5 years bids. Missed one transformation opportunity? Call me back in 2023.👇
Wow.
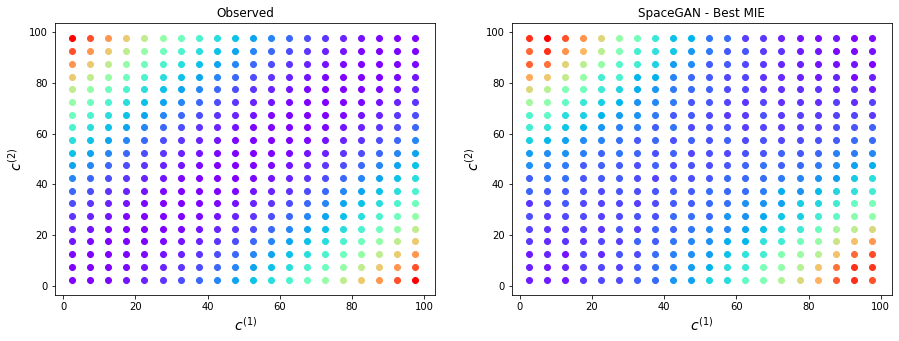
Deep learning on geospatial data is hard - mostly due to the sparsity and spatial complexity of the data.
SpaceGAN seems like an attempt to combine GANs with GIS methods - can it pave the way for robust geospatial data augmentation?
👀
We're happy to (finally😬) release code and slides for SpaceGAN, your friendly neighborhood-conditioned GAN for geospatial point data! Joint work with @askoshiyama@flennerhag:
▶️Code:https://t.co/2I6HJXtr4U
▶️Slides:https://t.co/YNZYFQX6x7
▶️Paper:https://t.co/Rwqrl559za
1/3 🚨Short thread🚨 Today, we're announcing the release of PySTAC, a Python library for reading, writing, and manipulating SpatioTemporal Asset Catalog (STAC) data. https://t.co/S2EuLZ75Aw
Choropleth maps are usually used for the visualization of statistical data such as election polls and economic indicators.
Take a look at this neat @washingtonpost visualization of fall foliage colors.🍁
https://t.co/pNxtq6h97x
Creating a great company culture is hard. Creating a great company culture in a software consultancy is even harder.
@atomicobject are nailing it with their cultural onboarding.
https://t.co/HKjTWFjptC
"We just wanted Spark to take over the world as an open source project".
Is the simplest #opensource business model the best one?
Interesting discussion at @a16z
https://t.co/3ehiSMJOwM
"Jane is 50 km from your location. Can you guesstimate where Jane is?".
With some open data and geo calculations - you can.📐
Nice experiment by Edden Gerber.
https://t.co/mkIgnd7YL4