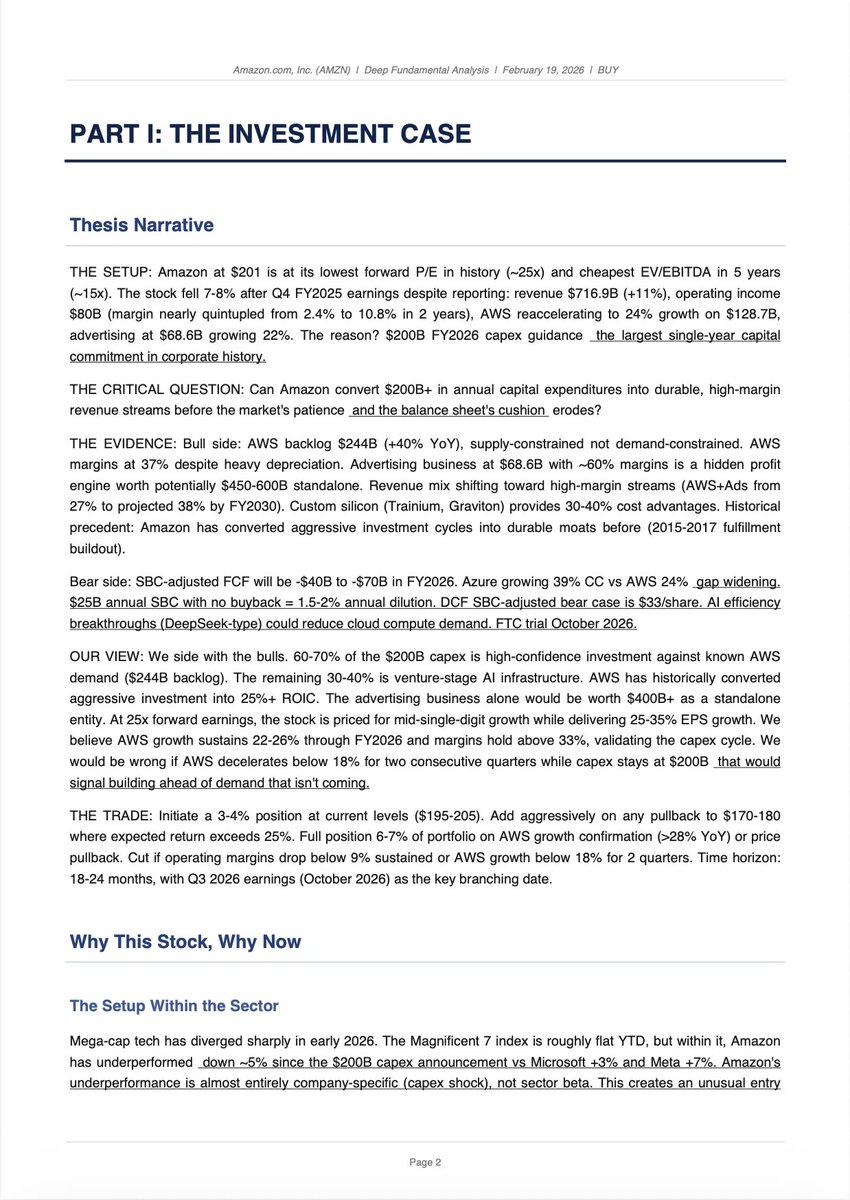
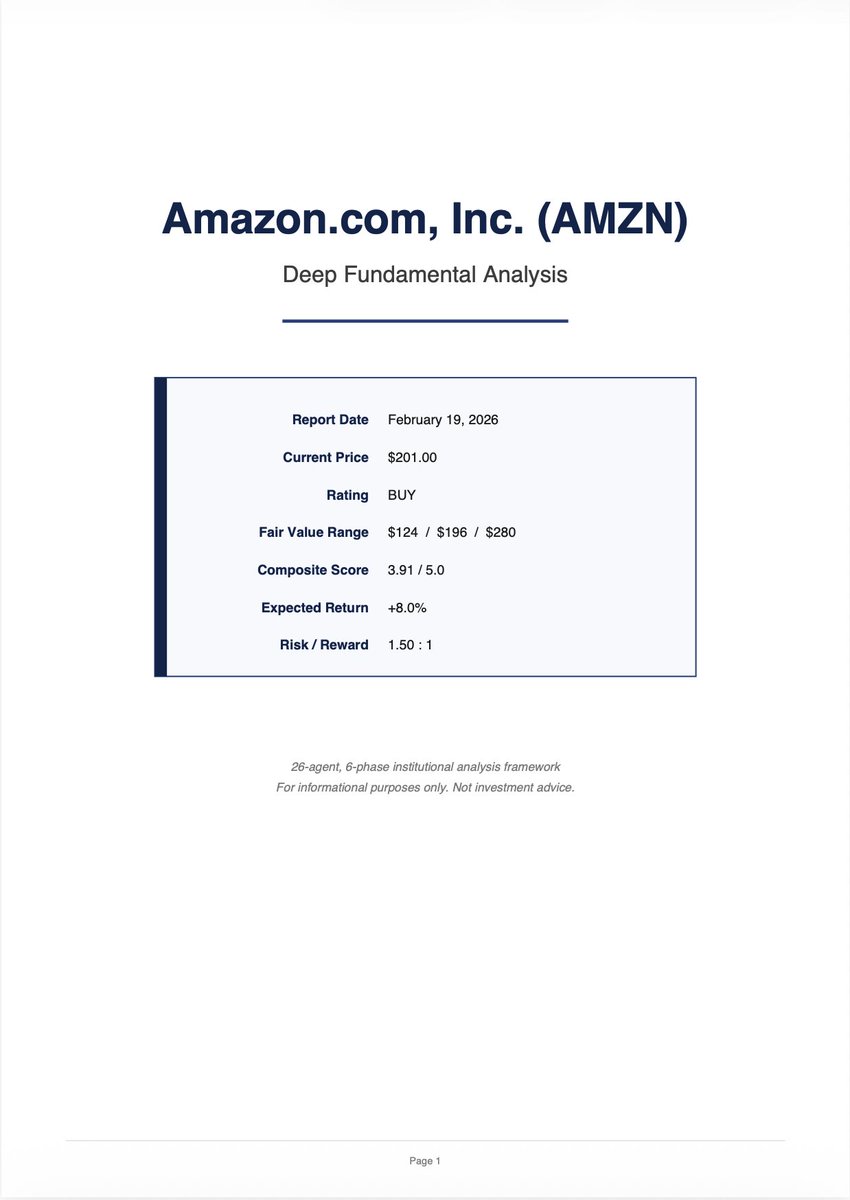
This is one of my most ambitious investment projects, and honestly, it's still very early.
I built a system where 26 AI agents work together across 6 phases to produce deep equity research. The kind of analysis that takes a team of analysts weeks, condensed into an hour. And with models getting better every few months, this is only going to scale from here.
Here's how it works.
Phase 1: Four agents go out in parallel to collect data.
> SEC filings, earnings call transcripts, market data, insider transactions, and competitive intelligence.
> They cross-reference across sources; nothing gets taken at face value.
> Each agent produces a full, detailed output and a compressed briefing that gets passed forward.
Phase 2: Six agents break down the financials.
> Revenue quality and growth trajectory with deceleration tracking.
> GAAP vs non-GAAP margin reconciliation.
> Balance sheet liquidity with dilution trajectory mapped against revenue growth.
> Operating and free cash flow with SBC-adjusted FCF.
> Historical beat/miss patterns on guidance.
> Each dimension scored 1-5 with a weighted composite, and the key financial tension was identified.
Phase 3: Four agents handle the strategic layer.
> Competitive moats scored 0-3 across five dimensions: network effects, switching costs, cost advantages, intangible assets, and efficient scale.
> Each one gets an AI-disruption overlay. Does AI strengthen or weaken this specific moat source?
> Management is evaluated on the founder-led vs. professional track record, capital-allocation track record, insider alignment based on actual transaction data, and governance structure.
> Industry analysis includes TAM sizing, adoption curve positioning, and an AI disruption taxonomy (additive vs. substitutive vs. deflationary, with specific evidence).
> Sector vulnerability decomposes the stock's movement into sector-wide and company-specific components.
Phase 4: Five agents build the forward-looking picture.
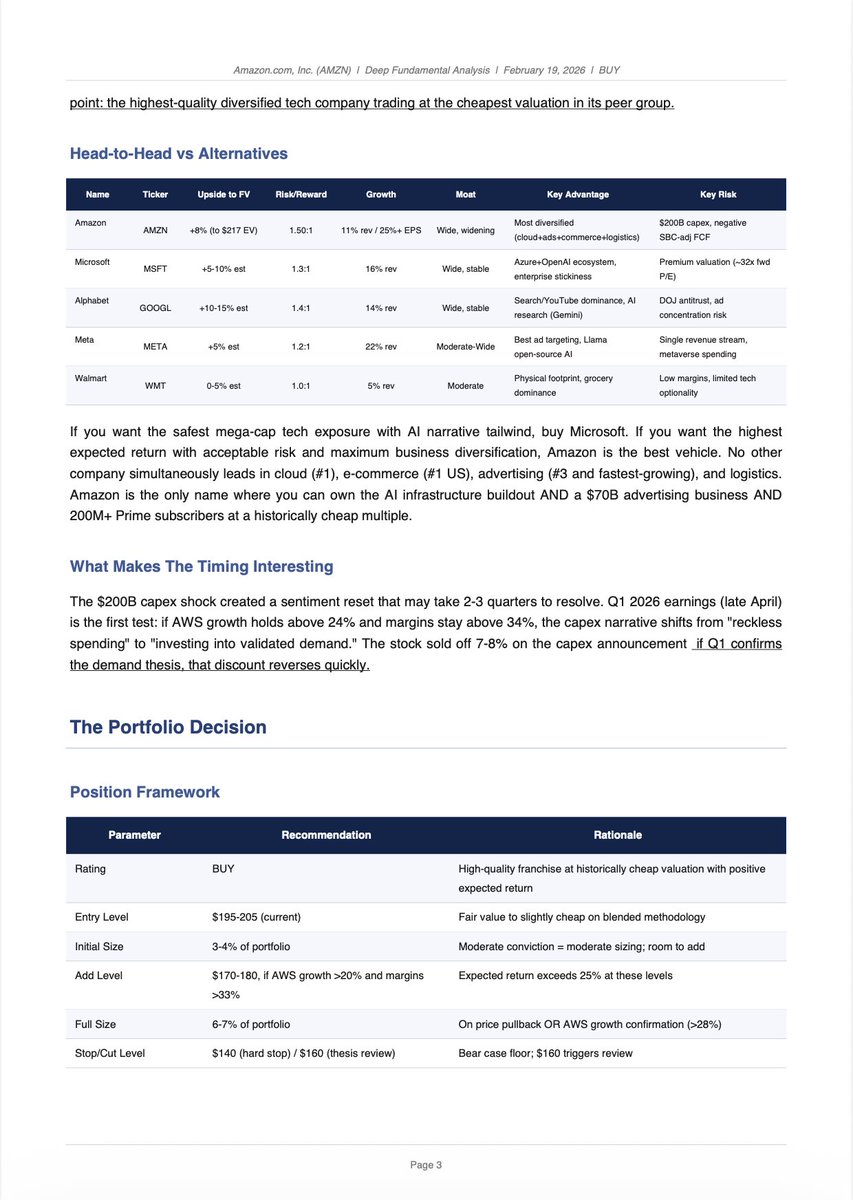
> Head-to-head peer ranking across 4-6 alternatives on upside potential, risk/reward, growth durability, and moat strength.
> Revenue evolution modeled by a stream, with per-stream gross margins and blended valuation-multiple implications.
> Competitive threat scorecards with actual data cards per competitor: users, revenue, funding, growth signal, enterprise presence, classified as share taker vs TAM expander vs disruptive substitute.
> Quarterly scenario progressions through 2027 for bull, base, and bear, with branching metrics identified.
> And a thesis narrative that opens with the critical question the market is debating and takes a side.
Phase 5: Four agents on risk and valuation.
> Top 7 risks ranked by probability times impact with timeframes.
> Three-scenario DCF with Year 5 revenue, FCF margin, WACC, terminal growth, and sensitivity matrix.
> 5-8 peer comparable company analysis with growth-adjusted multiples.
> Valuation convergence blending DCF at 40%, comps at 30%, historical at 10%, and revenue evolution at 20% into a probability-weighted expected value.
Phase 6: Three agents synthesize everything the other 23 produced into a final report structured in five parts.
> Investment case with thesis narrative. Investment debate with bull/bear arguments, each carrying confirmation and invalidation triggers.
> The numbers with every section ending in "what this means for the thesis." Supporting evidence with competitive data cards and a catalyst calendar.
> And a verdict with entry levels, sizing framework, add/cut triggers at specific metric thresholds, and a time horizon.
The architecture handles context window limits by having each phase produce compressed briefings (600-800 words) that get passed to the next phase. Full outputs stay available if an agent needs to dig deeper. Parallel execution within each phase, sequential across phases. File-based handoffs between every stage.
One important caveat: ignore the specific buy/sell recommendations and price targets in this version. The valuation models need more work. But what this system already does really well is give you a deep, structured understanding of the business. All the qualitative and quantitative aspects you need to actually make your own informed decision. The moat understanding, competitive dynamics, revenue quality breakdown, risk matrix, scenario mapping. That's the real value right now.
Built it for US stocks first. India is next (to be added soon with data pipelines API help).
Ran the first full test on Amazon. Still a lot to improve, but even at this stage, the depth of understanding it produces is genuinely useful.
Link to the full report and all 6 phase outputs in the next tweet 🧵
Feb Stats
Total Pages Scanned: 712,130
Total Files Read Successfully: 1,996
Total Size of Files: 366.03 GB
The page count 7 Lakh+ for a month is now the highest achieved page count ever.
Signal Dialogues #01 is live.
We built Signal because there wasn’t a clear, consistent voice telling the story of AI in India — across founders, capital, research, and policy.
For our first episode, @aakrit sits down with @vkhosla and @mukundjha to go over the rise of Emergent — probably the fastest growing software company in history to hit $100M ARR.
Shot at the sidelines of the @OfficialINDIAAI summit at the iconic @iitdelhi.
Timestamps:
00:00 – Intro: Fastest Growing Software Company Ever?
07:28 – Mukund's Journey: Google → Dunzo → Emergent
22:23 – You're Limited by What You Think You Can Do
27:08 – The $3M Bet That Built the Internet
47:11 – $100B AI Company From India?
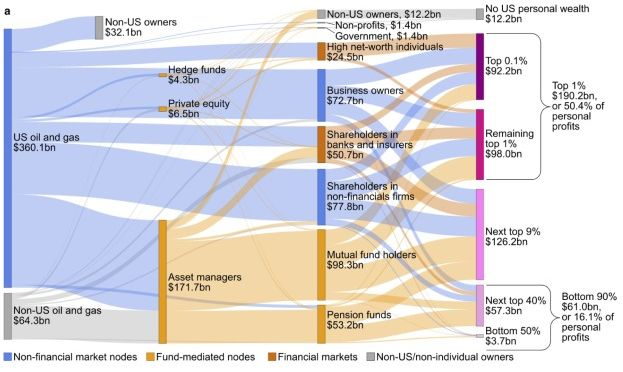
The war on Iran likely brings a new oil price shock and windfall profits.
So, who stands to win?
Our research shows: Last time around (2022), the US reaped the largest fossil fuel profits of any country ($377bn). 50% went to the top 1%, only 1% to the bottom 50%. A🧵
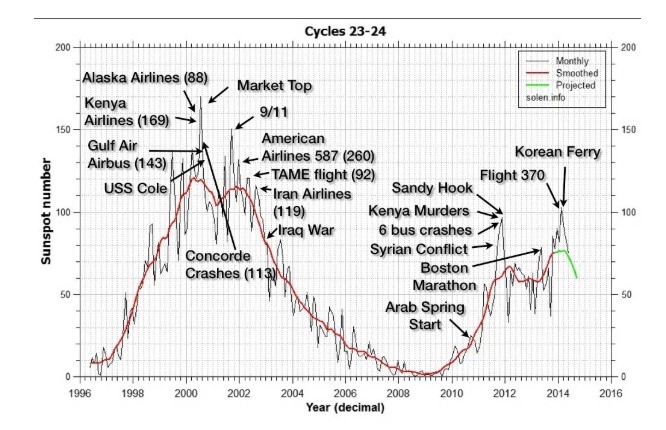
I wrote an article on this in 2021, helio-biology is one of the most fascinating topics ever
80% of the most significant events in human history occurred during the years of maximum sunspot activity.
High Solar activity tends to materialize in war, genocide, and political instability. In fact, there are 4.6 times as many deaths from war, genocide and persecution during Grand Solar Maxima than there were in Grand Solar Minimum.
The correlation coefficient of anthropogenic death rate per decade and Grand Solar Maximum is r= 0.9.
I want to post the article, but I was like 16 so it is pretty cringy
As someone who builds institutional level quant systems for prediction markets, this is the closest thing to a quant desk simulation I have ever seen publicly shared.
Runnable code for every model.
Read it before someone takes it down.
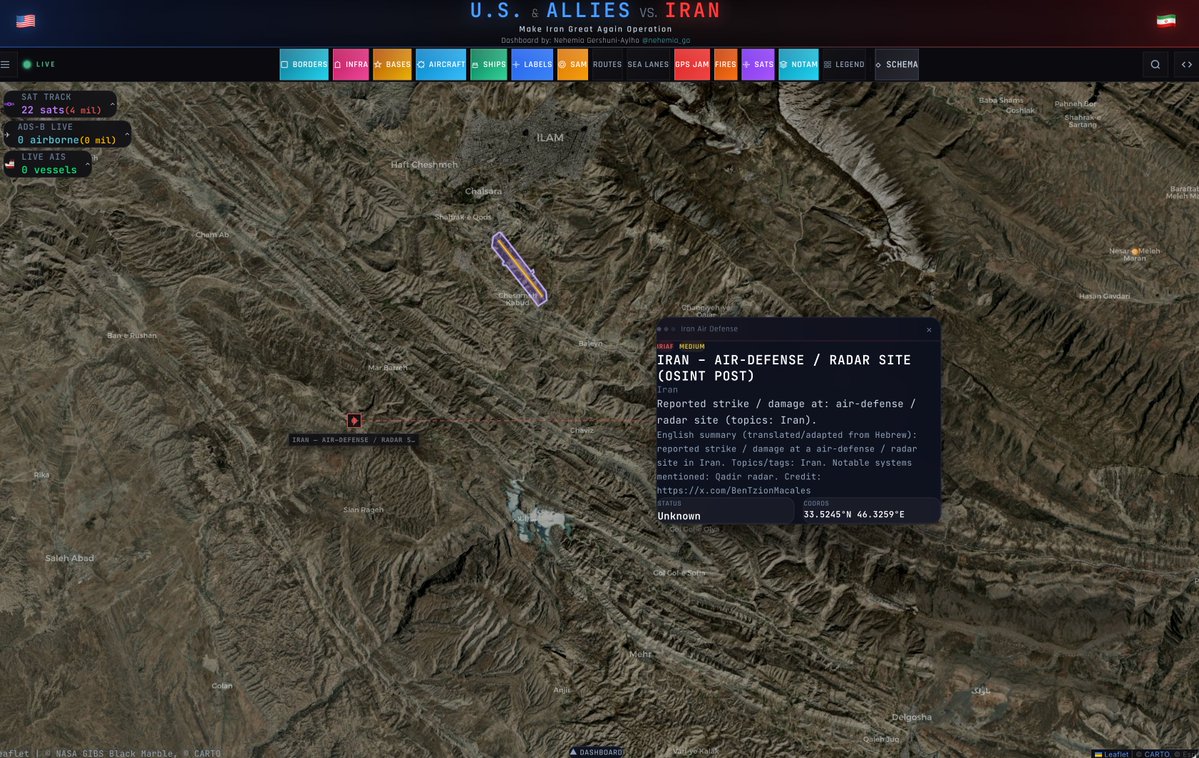
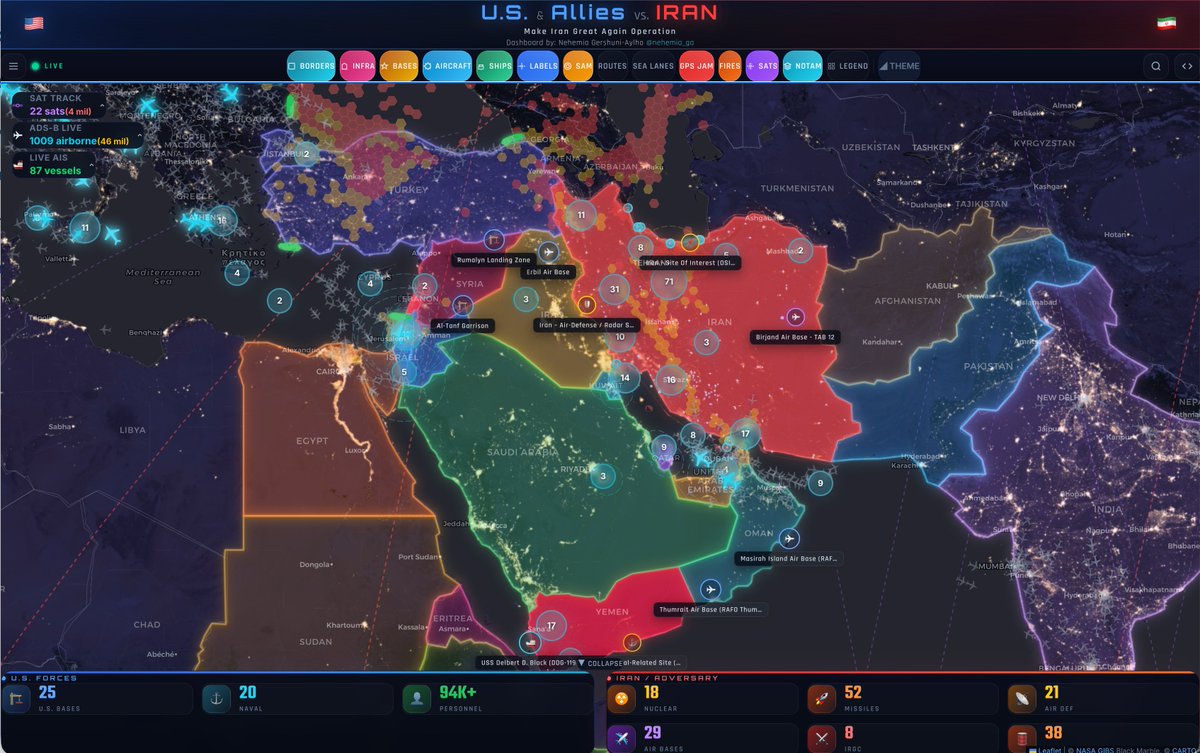
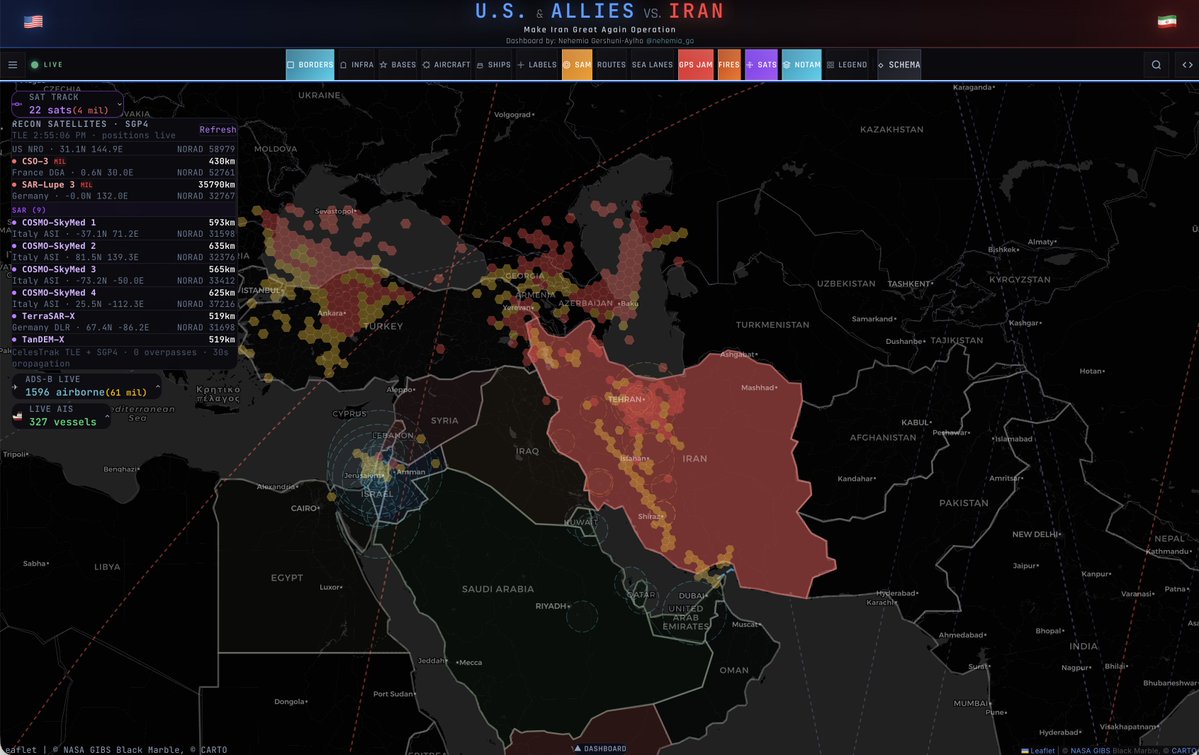
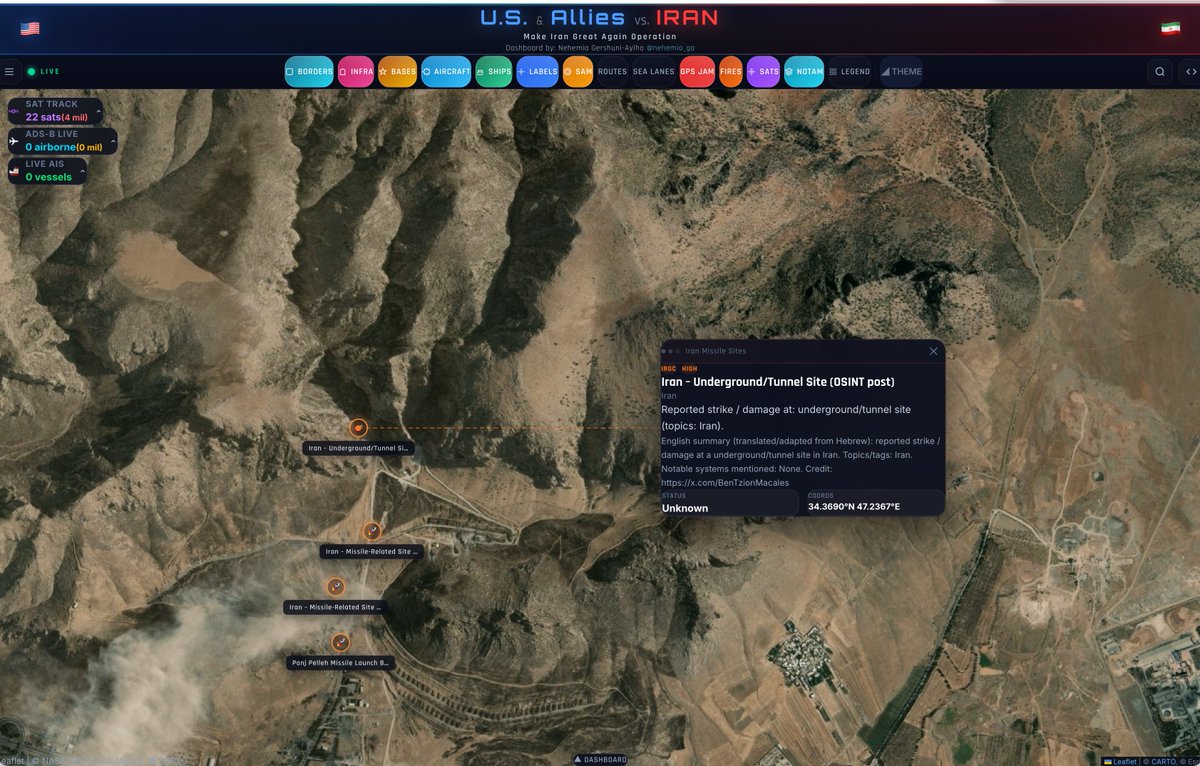
Built an OSINT-powered dashboard tracking the US–Iran conflict—fusing signals from a wide range of sources to follow war-relevant developments as they unfold.
PS You can also embed it on your site, and choose your fav theme, Red Alert theme included...
https://t.co/5VNDcAGO7d
As a retired Special Forces intelligence Operator who was on the ground fighting ISIS in Syria, one of my main goals now is teaching regular people how to build their own real situational awareness on fast moving global conflicts.
I want to give you the exact same tools we used in the field so I can train myself out of a job. My go to site since those days has been https://t.co/GVYLYZUHDi
When you select Iran as the map you want to see it isolates social media posts related to Iran from around the world while providing an interactive map with pinpoints. You just click the pins to read the actual headlines. It is timely and as accurate as open-source social media and intelligence can be.
It has a great filter that keeps out the trash posts, limits content to that which is generally verified and provides pictures if the source includes one.
In Syria it also provided what is called the Front-Line Trace whenever there were armies on the ground. It shows clear colored zones and boundary lines, so you know exactly who controls which territory in real time. You can use the timeline to go back and watch how the front lines moved hour by hour or day by day, so you know who owns what and when. It was incredibly accurate in our fight against ISIS and gave us a real edge.
If you go to the website right now you can see the effects on Kuwait, Qatar, Iraq, Bahrain, and any comments made by other countries in reference to the situation with Iran.
If you are interested in other places like Ukraine, Syria, etc. there are map options for them as well. They also have an app if you want that feature.
If you want to stay properly informed and start doing this on your own, head over and get familiar with the page today. I promise it is worth your time.
https://liveuamap.comDirect Iran map: https://t.co/34LHD57hvW
Go check it out and let me know what you think after you have played around with it. Happy to answer any questions you have as you learn it.
We are living through a dangerous time.
With so many situations to monitor, I've tripled the frequency of @DgtlEmb's scraping and synthesis.
We are now collecting almost 6,000 sources, 6x a day, for near-realtime updates from global capitals.
https://t.co/uPMOdFxGmr
To work or not to work, by @BrankoMilan
The Prosperity vs. Leisure Gap: Proponents of "working harder" point to the widening income gap between the US and Europe as evidence that the European welfare state is becoming unsustainable in a competitive global market.
The Productivity Paradox: Liberal economists like Paul Krugman defend the European model, arguing that high hourly productivity allows Europeans to "rationally choose" leisure over material accumulation.
The Geopolitical Risks: Countries like China and India (with grueling work schedules) may gain the economic and military might necessary to displace "leisure-heavy" nations in the global hierarchy, potentially turning former powers into second-rate economies.
And much more ... 👇
https://t.co/DGZEAbPogU
I am excited to say I'm joining @gleech at @ArbResearch!
Arb and Gavin have done some very cool projects over the years, and I am very keen to get stuck in and contribute.
If you are interested in working with us, email charles at https://t.co/AWD3MUgAT6
Highly recommend reading this again in the context of AI
“We are at that very point in time when a 400-year-old age is dying and another is struggling to be born — a shifting of culture, science, society, and institutions enormously greater than the world has ever experienced. Ahead, the possibility of the regeneration of individuality, liberty, community, and ethics such as the world has never known, and a harmony with nature, with one another, and with the divine intelligence such as the world has never dreamed.”
https://t.co/cMBC5binBT
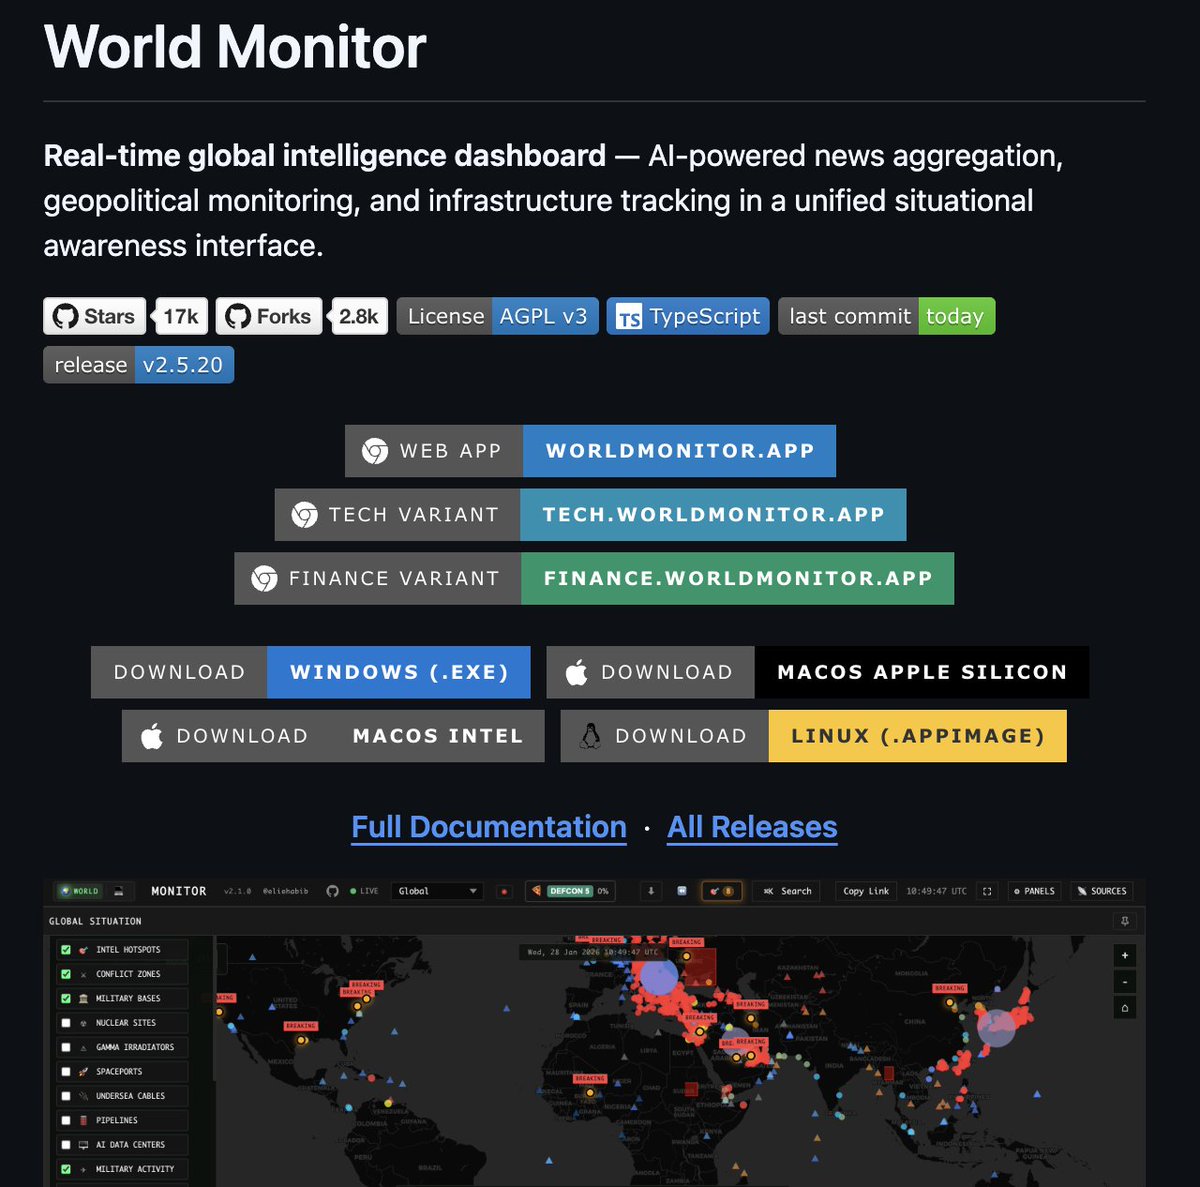
With everything happening between the US and Iran, World Monitor by @eliehabib is worth knowing about. It's an open source intelligence dashboard with a 3D globe, 36+ data layers, and 150+ news feeds that you can run locally. Think of it as a free, self-hosted alternative to expensive OSINT platforms.
> 36+ toggleable map layers including military bases, conflicts, naval vessels, satellite fire detection, protests, and infrastructure targets
> AI-powered focal point detection that correlates across news, military activity, protests, and outages to identify convergence zones automatically
> Country instability index generates real-time risk scores using a weighted blend of protest data, conflicts, displacement, outages, and climate anomalies
> Temporal anomaly detection flags deviations like "military flights 3.2x normal for Thursday" using a 90-day rolling baseline
> 8 live video streams (Bloomberg, Al Jazeera, Sky News, CNBC, etc.) embedded directly in the dashboard
> Runs AI summarization locally through Ollama with no API keys and no data leaving your machine
> 4 variants from one codebase: geopolitics, tech, finance, and a "happy news" version
> 100% free and open source, runs as a native desktop app on macOS, Windows, and Linux
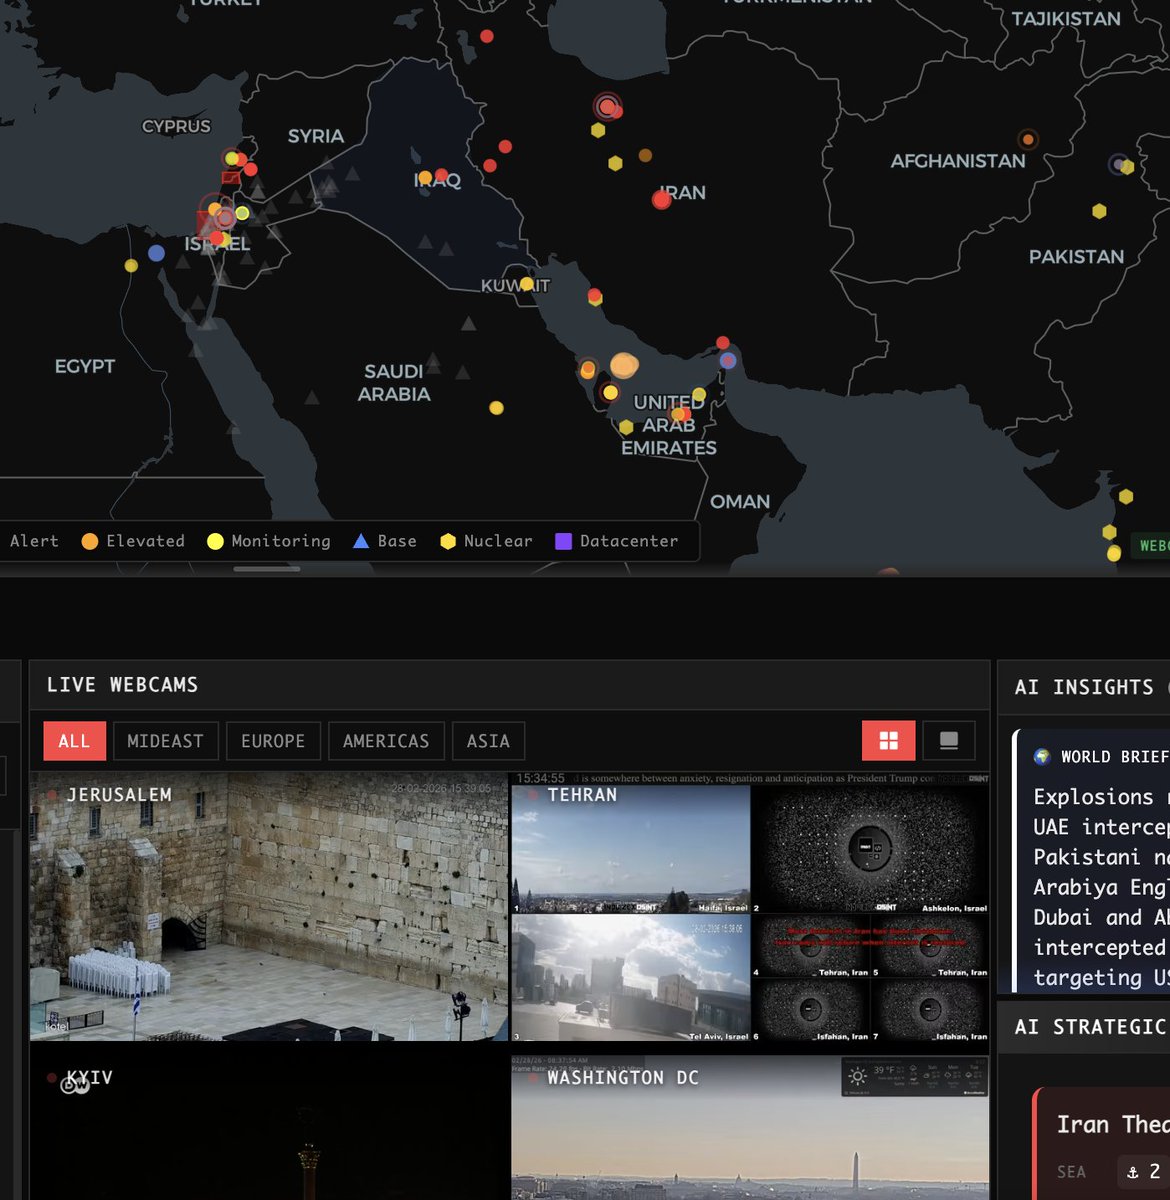
Introducing Glint Crisis Monitor.
A real-time situation room for the world's most volatile conflicts.
Live webcams inside Iran and Ukraine (More Coming Soon). AI intel briefings. Verified OSINT geolocations. Whale money flows. All in one terminal.
We built the situation room. So you don't have to watch the news.
Now live: https://t.co/9eTAdMYwOd
BREAKING: Inside The ElevenLabs Summit
The future of voice-first interfaces.
CEO, Mati Staniszewski (@matiii)
Head of Growth, Luke Harries (@lukeharries)
Series A Lead, Bryan Kim (@kirbyman01) of a16z
Klarna CEO, Sebastian Siemiatkowski (@klarnaseb)
AIUC CEO, Rune Kvist (@RuneKvist)
Founded in just 2022, @elevenlabs has scaled to $300M ARR & raised $781M in total funding across five funding rounds, most recently closing a $500M Series D led by @sequoia at an $11 billion valuation.
ElevenLabs began with a breakthrough human-like text-to-speech model & has since expanded into speech-to-text, dubbing, sound effects, music, & conversational AI. Today, it combines these models with integrations & enterprise-grade infrastructure to power production-ready platforms for businesses, creators, & developers:
- ElevenAgents enables enterprises to deploy voice and chat agents at scale, with customers including Deutsche Telekom, Revolut, Square, & the Ukrainian government using it for support, commerce, and citizen services.
- ElevenCreative allows brands like Duolingo, NVIDIA, & TIME to generate and localize high-quality audio in 70+ languages.
- ElevenAPI provides low-latency voice infrastructure for developers, powering platforms from Meta & Epic Games to Salesforce, MasterClass, & Harvey—reaching more than one billion users globally.
Leaving the Summit, after seeing the product depth, long-term vision, and caliber of operators & partners around them, it’s clear ElevenLabs has built one of the strongest & fastest-growing companies in AI today.
Really impressive.
Love it that an Indian startup just out-played Oura.
Not by being cheaper, but by building a genuinely better wearable with insane tech + AI
Preordered the second I saw it.
This is incredible work @deeppurpled@UltrahumanHQ 🔥🔥
$3,500 -> $23,400 in 11 minutes on Iran-Dubai escalation
I saw it 9 minutes before CNN
@glintintel caught military movements before media even knew
this morning:
> Glint detected unusual aircraft near Dubai
> flagged "Middle East tensions" market at 8¢
> entered YES
> CNN published 9 minutes later → 76¢
+850% while you scrolled Twitter for "breaking news"
today: +850% on Iran
yesterday: +6,950% on Israel
9 minutes early = $20K profit
0 minutes = watching others win
you're trading on news
I'm trading before news exists