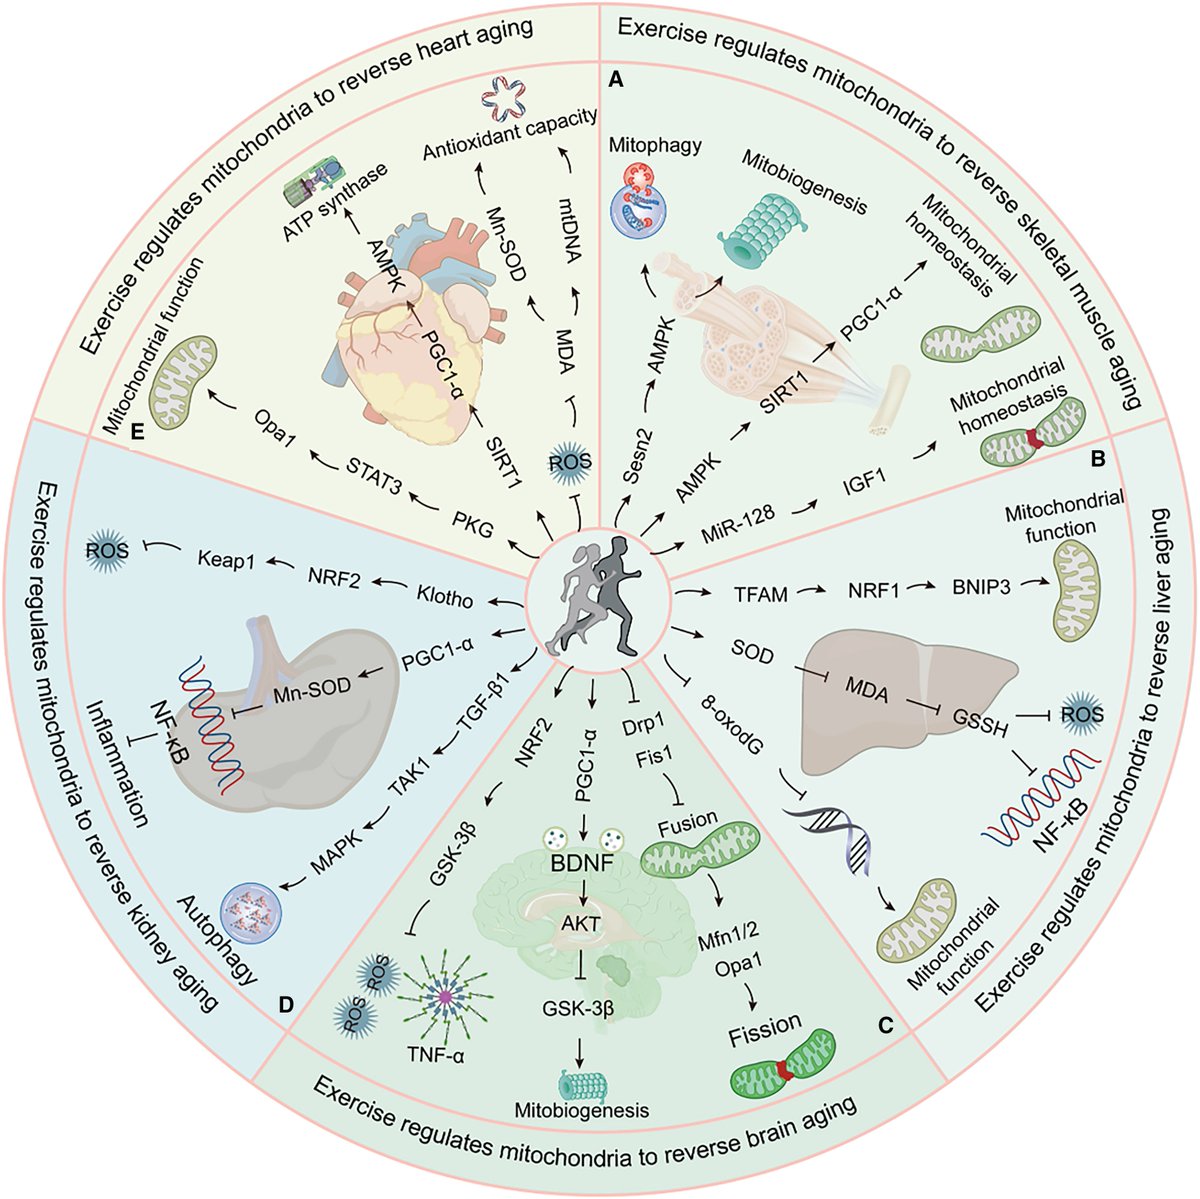
Exercise-induced mitochondrial remodeling in energy-demanding organs during aging
This review summarizes common and specific responses to exercise in mitochondrial regulation across various organs and provides a comprehensive cross-organ analysis.
https://t.co/2SSODaRC8A
VO₂ max decline with age isn't driven by a single catastrophic failure. It's driven by four simultaneous biological processes that individually seem manageable but compound over decades into something substantial.
Each one alone would be survivable. Together, they explain why aerobic capacity falls by 46% between ages 20 and 70 while cardiac output only falls by 31%. The gap is peripheral.
First: sarcopenia preferentially strips away mitochondria-rich type II muscle fibers. You're not just losing muscle mass. You're losing the fibers with the highest oxidative capacity—the ones that can extract and utilize the most oxygen from delivered blood. The metabolic engine shrinks before the fuel delivery system does.
Second: mitochondrial density and efficiency decline independently of muscle fiber loss. Fewer mitochondria per fiber. Smaller mitochondria. Lower activity of the respiratory enzymes that convert oxygen into usable energy. The machinery that remains becomes less capable of processing the oxygen that arrives.
Third: capillary networks thin through a process called capillary rarefaction. Fewer capillaries per muscle fiber means oxygen has to diffuse farther from blood to mitochondria. The increased diffusion distance slows transfer, creating a spatial bottleneck even when oxygen delivery from the heart is adequate.
Fourth: interstitial changes create additional barriers to oxygen movement from blood to cell. Increased connective tissue. Chronic low-grade inflammation. Fibrotic remodeling of the extracellular matrix. Each adds resistance to the oxygen cascade at the final step—the movement from capillary to mitochondrion.
The combined effect shows up clearly in oxygen extraction capacity. Skeletal muscle extracts roughly 80% of delivered oxygen at maximal effort in young adults. By ages 75 to 80, that figure falls to approximately 60%—a 20 percentage point decline in a variable most aging research has historically underemphasized.
You can deliver all the oxygenated blood the heart can pump, but if the muscles can't extract it, VO₂ max still falls. And by late middle age, nearly half of the total limitation on VO₂ max is peripheral in origin. In younger adults, approximately 77% of the limitation is central and 23% peripheral. In older adults, that shifts to 56% central and 44% peripheral.
The peripheral decline is trainable. The biological machinery driving it—mitochondria, capillaries, oxidative enzymes—remains responsive to exercise well into the later decades of life. But different training modalities target different parts of the cascade.
Endurance training rebuilds capillary networks most reliably—13.3% increase in capillary density over 8 to 10 weeks. HIIT is the most time-efficient route to mitochondrial adaptation, approximately 1.7 times more efficient than endurance training. SIT delivers the fastest mitochondrial signal per minute but produces no significant capillary gains, making it a complement rather than a replacement.
The decisions made in the fourth and fifth decades of life shape the physiological ceiling of the seventh and eighth. Each of these four processes is compounding quietly during those decades. None is catastrophic alone. Together, they determine whether you maintain functional capacity or fall below the threshold required for independent living.
Take a look at this clip from BBC's 3D replay of the game and the goal kick just before England's goal. I don't know where the data comes for this, but this clearly shows a bump in the otherwise smooth trajectory of the ball right where the spidercam would be. #worldcup#engnor #mmfutis
Do athletes respond similarly when recovering from a period off? Odden investigated that by letting cyclists undergo 2x8 wks of training. The responses were surprisingly different between the two periods showing the individual heterogenety of adaptation. https://t.co/FVCLiJbUGu
Andoni Iraola to Liverpool?
The schedule with Europe and Premier League, intensity of his style of play, injury record & player profile at Liverpool is raising a number of concerns
Ahead of the Arne Slot Reaction Show we recorded on Sunday for @TheAnfieldWrap I took a deeper look at the injuries, 1st vs 2nd half of season records & approach taken at Bournemouth to understand whether concerns are matched by the data and whether there are any positive signs to ease concerns……
Graphic below is the xG rolling trendline 01/01/26 to end of season @Statsbomb for Bournemouth
1)INTENSITY
The data backs up the eyes
22/23 Iraola's Rayo Vallecano forced more high turnovers which led to a shot (68) than any side in the top five European leagues except Bayern Munich (73)
In the past 2 seasons at Bournemouth Iraola’s side are
-99th percentile and 98th percentile for high press shots
-100th and 96th percentile for aggression
2)INJURIES
Up until July 2025 Iraola at every club – every season – had a negative trend ….
Iraola had NEVER overseen a second half of a campaign that outperformed the first in terms of points gained
He had a reputation for burning his squad out during the first half of the season and tailing off with injury issues even without European football
In 2024/25 season they lost over 1100 days to injury
3)2025/26 – JANUARY CHANGE IN APPROACH & POSITIVE RESULTS
2025/26 Bournemouth
A) Post their best injury numbers as an aggregate of injuries and illness suffered in the past 8 seasons
B)153 games missed due to injury ranked 8th in league
C)Post a huge improvement January 2026 to end of season
D)End the season going 18 games unbeaten
E) Iraola’s side end the season performing well during the 2nd half of the season with a budget that should result in a lower bottom half finish
Quite remarkable when they start the season absolutely flying - 2nd place after matchday 9
Then suffer significant injury crisis and go 11 games without a win between Matchweeks 10 to 20
WHY? WHAT CHANGED JANUARY ONWARDS?
A lot.
A)NEW PERFORMANCE CENTRE
Bournemouth had invested over £30m in a new sports science and medical performance centre.
This was functioning fully January 2026 onwards
B)DR ROBERT MARSHALL
Recruited in summer 2025 he arrived from RB Leipzig in July last year as Bournemouth’s Director of Medical and Performance.
Iraola raves about him
His role was in part to ensure all the departments within the performance centre worked in harmony in conjunction with Iraola.
C)SQUAD AGE
2nd youngest squad in the league I am sure helps
D)IRAOLA
Iraola made tweaks in line with the performance centre recommendations
Training and in game set up changes reportedly helped
Rotation
Strategic substitutes
Arguably had the performance centre been in place July 2025 Bournemouth may have posted even better improvements in their injury data at the end of the 2025/26 season as it’s skewed by first half of season data
There is a lot more to delve in to in respect of his tactics, in and out of possession set up, authority, leadership and training methods
Based on the work done at Bournemouth January 2026 onwards it would suggest that Iraola can work positively complementing the performance staff at Liverpool
He will also have even greater resources in all areas at Liverpool
He has also ended the trend of his sides physically and results wise blowing up during the 2nd half of a season
There is a lot he needs to prove – and managing European campaign and Premier League is an obvious one – but he can point to the lack of performance centre (up until recently at Bournemouth) and the results since the integration of the performance centre / Dr Robert Marshall, positively as evidence of how he could work with the performance staff at Liverpool to balance intensity and the schedule
Instead of spending 2 hours on Netflix, watch this Stanford lecture.
It will teach you more about how LLMs like ChatGPT and Claude are actually built than most people learn working inside top AI companies for years.
One of the best free deep dives into modern AI on the internet.
Save this.
What truly limits endurance performance: the brain, the muscles, or both?
Dr. Marius and Dr. Paul discuss how muscular function, fatigue, and central regulation shape performance.
Full episode: https://t.co/2eG11aX5Cl
@ProfTimNoakes@LoreofRunning1@PaulBLaursen@Athletica_AI
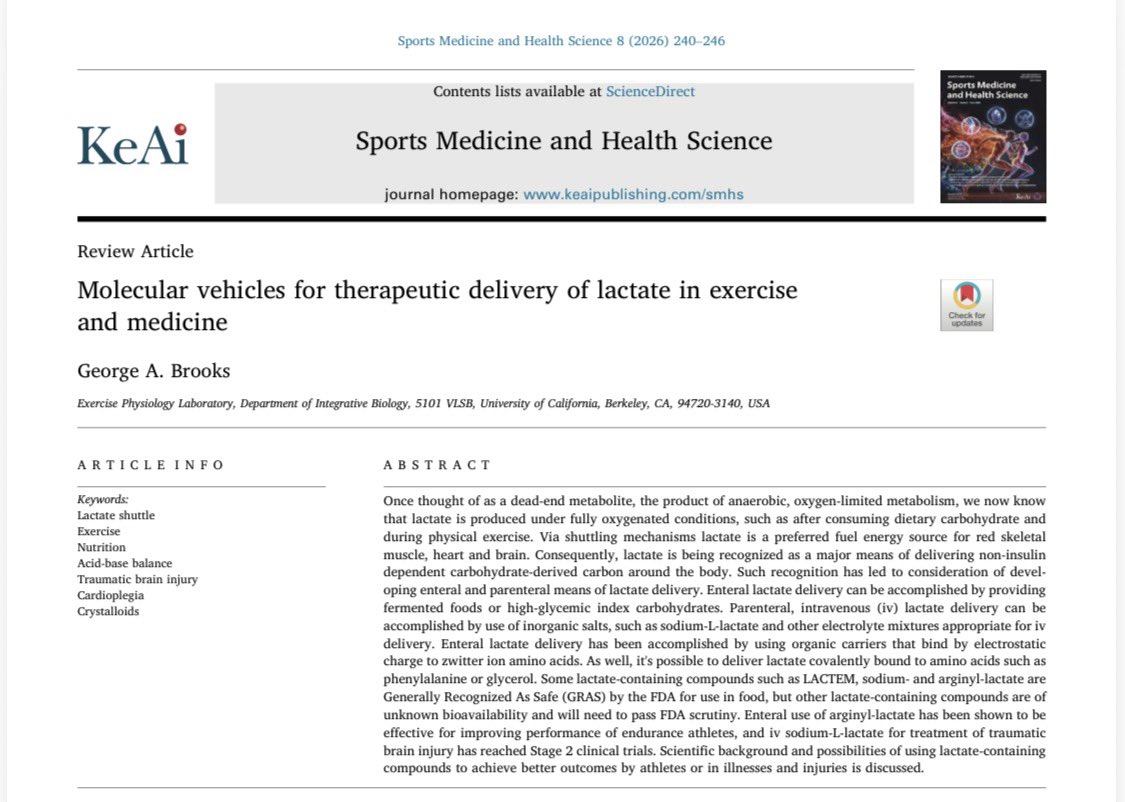
“Exogenous lactate” field is heating up - it seems!
Check the latest paper published by George Brooks, father of modern lactate understanding, addressing the main gap in Exogenous Lactate administration: exogenous delivery.
Molecular vehicles of Lactate: https://t.co/hSfXFyi3rz
My updated metabolic map is less focused on substrate utilization and thresholds and more focused on metabolic stability. I believe the shift is subtle but important.
Instead of only asking:
“What fuel is being used?”
The model also asks:
“How stable is the metabolic system under stress?”
In this framework, lactate becomes the central proxy to understand the balance, drift, or overload of the metabolic system.
Approximate translation and comparison with different models:
• Zone 1 = low metabolic stress
Clearly below LT1/VT1
• Zone 2 = metabolic equilibrium
Near LT1/VT1, where lactate production and clearance remain tightly matched and the system operates at its highest sustainable balance
• Zones 3–4 = metabolic drift
The system progressively moves away from optimal mitochondrial matching capacity, even if lactate may still achieve a “steady state”…CP/MLSS/VT2/LT2/V4…
• Zone 5+ = metabolic overload
Above CP/MLSS/VT2/LT2/V4, where no true steady state is physiologically achievable
The key conceptual distinction:
A lactate steady state is not the same as optimal metabolic equilibrium.
The metabolic equilibrium ceiling is near LT1/VT1 and Zone 2.
The steady-state ceiling is CP/MLSS/VT2/LT2/V4.
Performance is ultimately defined by how long the body can preserve metabolic equilibrium.
The aerobic vs anaerobic model is not wrong because it’s simple. It’s wrong because it implies a switch where there is only a continuum.
Glycolysis is always active. Lactate is always produced and cleared. Mitochondria are always involved. There is no moment where the body “switches” from one system to another. What changes is the balance between glycolytic flux and mitochondrial capacity and lactate is the best real-time proxy of that balance.
I proposed in 2013 a model based on substrate utilization. Now I propose an update of that model built around four metabolic states. From metabolic equilibrium at Zone 2 all the way to metabolic overload, where the central question is not what fuel you’re burning, but whether the system can sustain balance.
Ultimately, the ceiling of equilibrium matters more than the ceiling of oxygen consumption.
👇
https://t.co/CWkZyRohzT
Early maturers dominated youth academy teams, but none reached top European leagues. All who did were late maturers, likely benefiting from stronger technical, tactical, and psychological development over time. ⚽️🌱
👇🏼
https://t.co/jr8rholgOv
"Do fast players stay fast & slow players stay slow."
It's one of the most common assumptions in youth sport.
A recent study tracked 475 players from U12 to U19 over 8 years to test it.
The answer is more complicated than you might think. 🧵
another day 1: learning how to learn and think
- critical thinking
https://t.co/8aqQzPnQKY
- logical fallacies
https://t.co/CV0a25EQtF
- reframe problem
https://t.co/Hu5RodZYCg
- 5 whys method
https://t.co/YC4Z94gfPX
- inductive & deductive reasoning
https://t.co/tR15VDewhR
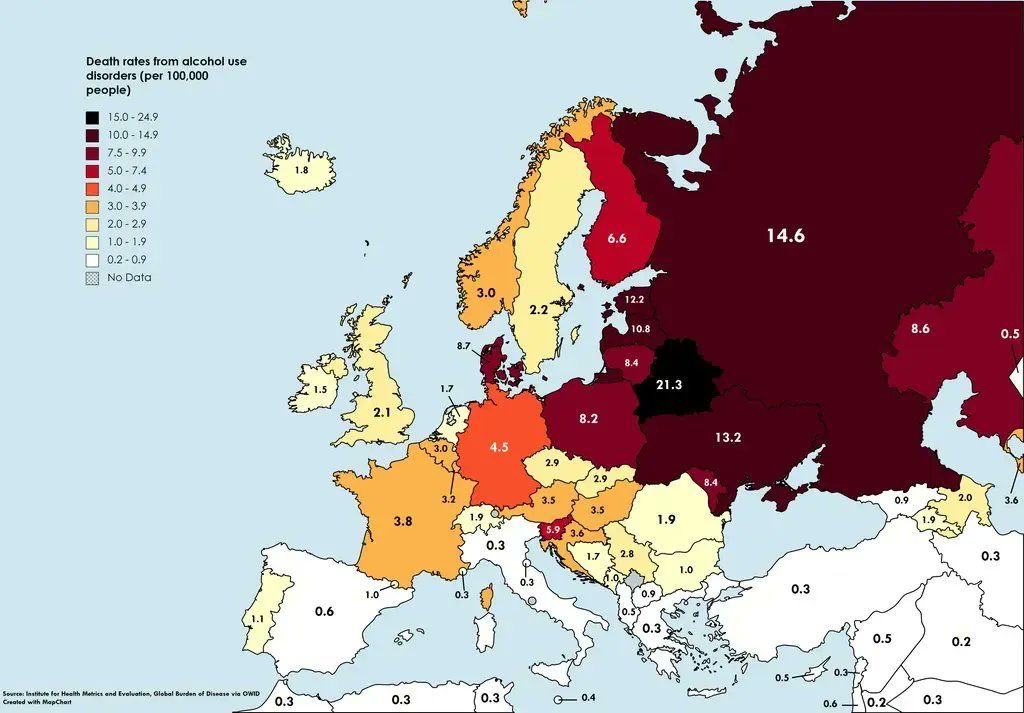
Alcohol death rates in Europe. Apparently very low in cultures where drunkenness is frowned upon and where alcohol is only consumed in company of others and served alongside meals. Spain and Italy for example. Source: https://t.co/Ax6LWw8MDK