🐘 Introducing Postgres Internals in 3D.
🌟 https://t.co/IGhhfb7hPW
Stop reading boring diagrams. Start exploring PostgreSQL.
An interactive 3D map to understand how Postgres actually works.
100% free. Built for developers.
https://t.co/0PCkuN6AlZ
Before you ship a vibe-coded site, make Opus 5.5 audit it like a performance team.
Send 4 subagents across these 20 checks:
*Images + fonts*
• Convert images to WebP/AVIF and size them correctly
• Use next/image for large assets
• Lazy-load below-the-fold media
• Prioritize the main above-the-fold image
• Use framework-native font loading
• Keep fonts limited
• Remove unused third-party scripts
• Delay analytics/chat widgets until after load
*Frontend*
• Run a bundle analyzer
• Replace full-library imports with only what you use
• Dynamically import heavy charts, editors and maps
• Fetch homepage data on the server
• Stream AI responses
• Use skeletons while loading
*Database + APIs*
• Add indexes for filtered/sorted columns and RLS fields
• Use (select auth.uid()) in RLS policies
• Kill N+1 queries
• Paginate long lists
• Cache shared API responses, never user-specific ones
• Move emails, image processing and reports to background jobs
*Servers + network*
• Keep functions near the database region
• Use static pages or ISR where possible
• Parallelize independent API calls
• Test on low-end Android + slow 4G
Then paste this:
“Send one subagent per group to check it without editing anything, and note which file each issue is in and which page it affects. Run the database subagent at high effort. Before changing anything, run a production build or preview, then run Lighthouse three times in mobile mode on the homepage and the two or three slowest pages and note the median. Then fix everything yourself from their lists, measure again the same way, and give me the before-and-after numbers. Don’t remove features to gain speed. Ask me before removing dependencies, changing the deploy region, or changing the database.”
time to talk about pricing in HFT
01/ micro price or mid price?
well none, you need a proper filter.
mid price and micro price can easily be manipulated, especially during weekends or illiquid markets.
what you want, is to filter out the noise from the signal.
1. don't overreact to price movements, wait for confirmations.
2. anchor on the deepest side of the book.
3. the tighter, the closer to the actual mid
02/ kalman filter
there is a very good description of it in the book "Algorithmic Trading: Winning Strategies and Their Rationale"
not for lead-lag arb or tight quoting.
good if you have one fast but noisy source and one slower more reliable source.
be careful to align on origin timestamps.
rewind, correct, replay.
03/ future contracts rolling
https://t.co/mXasONoyet
outdated alfa, but if you look around closely it's still a good example on how you can print with better pricing models.
look at the oracles used by each market, there are lots of innefficiencies or MMs mispricing out there.
Introducing Anatomy
Describe a machine in one line. Claude brings it to life.
- Interactive isometric wireframes you can rotate, inspect and explore
- WebGL shaders for fire, water, plasma and more
- Real 3D motion, with individual parts that rotate and move
Install it as an agent skill. Fully open source.
I need help from my street quants.
When I create features, I plot quantiles of the feature value vs forward returns, I often get this kind of results: linear positive relation in the middle, and reversion at the tails of the feature.
I added an example, of feature= 10 days returns / 10 days std. the three lines are just the same feature but on 3 terciles of the universe by ADV.
In the end, I want to use a linear model so it won’t pickup this behavior.
1. I could use a non-linear model (will probably overfit)
2. I could apply a transform to the feature such that larger values of the features gets lower.
3. I could ignore this issue
Still not figured out what the best solution is, any advice ?
This is a must read for all aspiring traders/PMs
Contrary to clever punditry, risk is both quantitative and qualitative in nature. The physics of money works under a stable regime but the seismic monetary resets, where the big money is, occur by the whims of the human condition
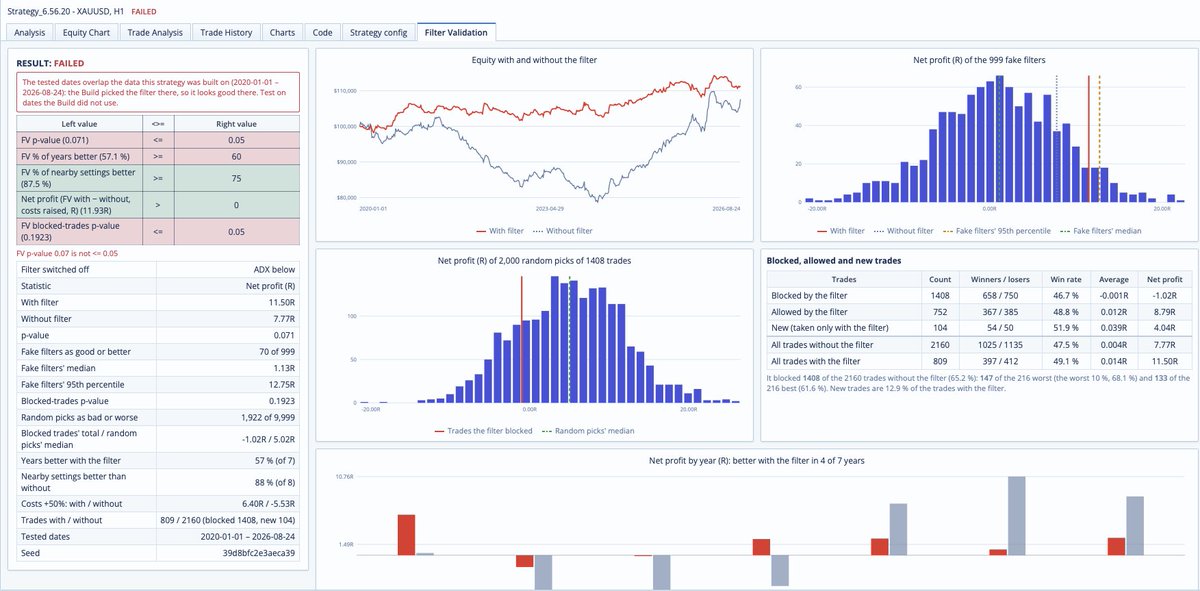
Don’t underestimate how much value you can get from a free blog. I came across a blog by Sergi (the #1 trader on Darwinex) explaining how he evaluates whether a filter actually improves a trading strategy.
I used his framework to build a model that systematically evaluates the effectiveness of filters applied to any trading strategy. I’m pretty confident this will become one of the core pillars of my development process going forward.
I combined his framework with another concept I learned from Timothy Masters (Monte Carlo Permutation Tests) to develop the full model.
There are so many gems like this on Sergi’s website. You just have to dig.
Here’s the blog post:
https://t.co/VfcJZaweUZ
Daha önce parasını yaklaşık 10 bin katına çıkaran Qullamaggie ile ilgili bir paylaşımım olmuştu.
Manuelci arkadaşlardan inek öğrenci modunda detaylı araştırmak isteyen olursa pozisyon büyüklüğü risk ve poz kapatma tarzı ile ilgili oldukça detaylı bir makale var alıntıda.
Kabaca özetlersek: her bir tradede çok az miktarı riske atıyor ve poz kapatırken kuralcı davranışlardan daha çok sezgisel hareket ediyor.
Detaylar makalede.
a few more good HFT tricks for you to try out
again. not rocket science. just there to nudge you in the right direction.
01/ multiple feeds
subscribe to multiple feeds, from different places, with different IPs, multiple times.
and deduplicate the output.
you never know why one feed or the other can be faster in different conditions.
benchmarking when the market is calm has nothing to do with high vol times.
even the worst median can be the best p99.
yes ultimately you want a private fiber w/ @Avelacom_Corp but until then just compound the feeds you have and make the best usage of em. can already get you pretty far.
02/ always a/b test
keep a low risk engine running on the side that serves as a reference for your optimizations.
first, well you can still catch some liquidations but more importantly bugs early on and actually see your improvements.
more volume, more activity = more messages going through your system, you need to be able to spot where is the bottleneck at all times.
03/ stale data is worse than no data
you have to know your data feeds, their edge cases, especially when pricing fair value using multiple sources and layers.
each layer should have its own thresholds and protections, an oracle feed you're using for a basis or a weekend mid price should not be treated equally.
Some intuition on relation to shrinkage... For a distance uncertainty set, the min-max is shrinkage exactly.
1. The covariance matrix is a grid of numbers, one for each pair of assets. Each number describes how the assets move together. Pair an asset with itself and you get its own variance. Your portfolio's variance adds up every number in the grid, each one multiplied by your weights in its two assets. So the pairs where you hold a lot of both assets count the most.
2. You *do not* trust the grid you estimated. The 'uncertainty set' says "the TRUE grid is somewhere near the one I estimated, within a set distance." Distance is a ruler for grids: take the gap for each pair of assets, square the gaps, add them up, take the square root.
3. Think of the min-max as a game with two players. You pick a portfolio, then an "opponent" picks the worst grid inside the uncertainty set: the one that makes your portfolio look the riskiest. You want the portfolio whose worst case is LEAST bad.
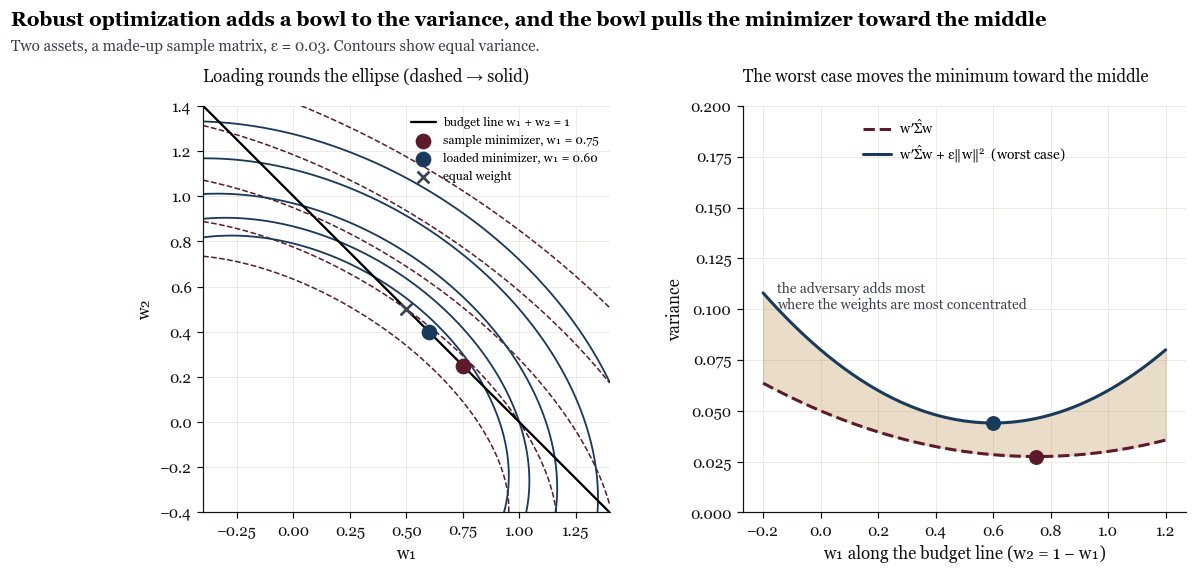
4. The "opponent" has a fixed amount of error to spread over the grid. It does the most damage on the pairs that count the most for you. So its best move copies your own weight pattern, scaled to fit the distance - the most error goes where you hold the most. The damage then comes out simply: the distance times the sum of your squared weights. For a 60/40 portfolio and a distance of 0.03, that is 0.03 * (0.36 + 0.16) = 0.0156. The opponent's grid is still a valid covariance grid, so this worst case can really happen.
5. A common fix doesn't need this game. Add the same small number to every asset's own variance, and leave the rest of the grid alone. That fix is diagonal loading, a standard shrinkage. It adds the small number multiplied by the sum of your squared weights to the variance of any portfolio. That is the same charge the "opponent" makes, for every portfolio. So the illustrative game picks the same portfolio as loading with the distance. The min-max is shrinkage, and the distance is the amount of shrinkage.
6. If your weights add up to 100%, the sum of squared weights is smallest when you spread out evenly. 50/50 gives 0.25+0.25=0.50; 90/10 gives 0.81+0.01=0.82. So the charge taxes lopsided bets and nudges you toward equal weight. More doubt means a bigger distance a harder nudge. In the second picture, with two assets, the safest mix on the estimate is 75/25. A distance of 0.03 moves it to 60/40.
@__paleologo's red book that @0xFaust12 cited states this in §10.2.3. Doubt with a different shape gives a different shrinkage. If you doubt each correlation by a set amount, the charge is that amount times a squared total: add up each holding's size times its vol and then square the sum.