It's official! Bluekurtic is live on website and app.
All your market insights in one place: shorts, daily podcasts, articles, flash updates, clips, webinars, proprietary dashboards, and our Berry Stock Picks, straight on your phone.
Sign up today!
https://t.co/CHgcBU9Igy
Yes, 8 of the 17 Julys finished negative. However, our base case remains for the S&P 500 to reach a new all-time high and end July in positive territory.
https://t.co/qwsU5R8ZSH
New highs this July are more likely than one might think. When the S&P 500 $SPX made at least one new all-time high in June, July also recorded at least one new high in 16 of past 17 cases.
Add to that the fact that $SPY hasn't finished a July lower since 2015.
Not just the broader index, July seasonality favors Technology, Industrials, and Discretionary too.
Major earnings reports begin next week. Strong earnings and guidance could provide the catalyst for new highs in the S&P 500 $SPY, which is our base case for the month.
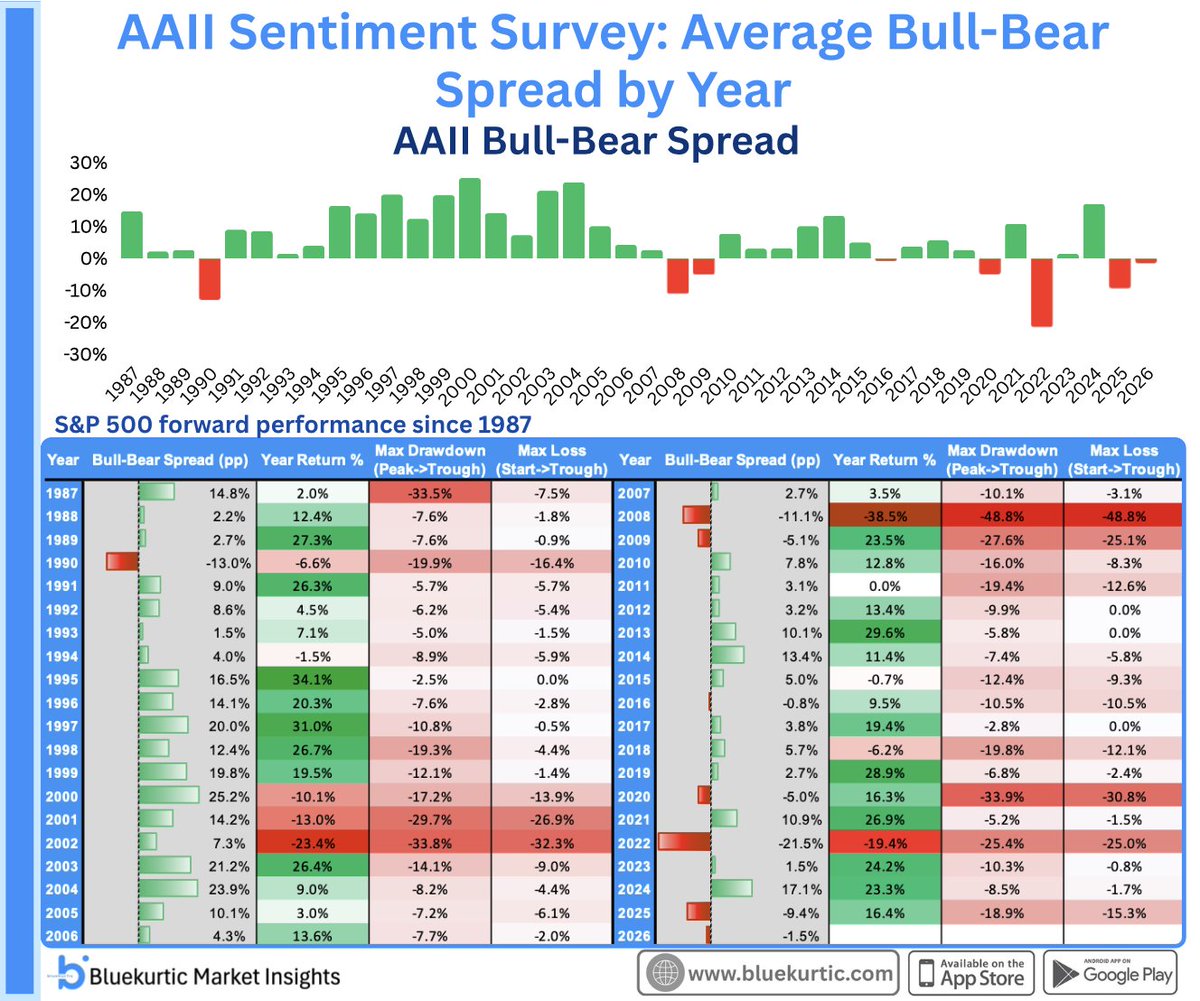
Latest AAII sentiment survey showed bears outnumbered bulls by 10.9%. Not something one typically sees at a market top.
Whenever a calendar year averaged more bears than bulls, following year was always positive.
2025 and 2026 (YTD) are on that list. See where this is going?
It's a HODLer's market. Since the 2023 bull market began, simply buying and holding the S&P 500 $SPY has returned over 100%.
By comparison, cumulative gains from intraday only or overnight only returns were each less than half of the buy and hold return.
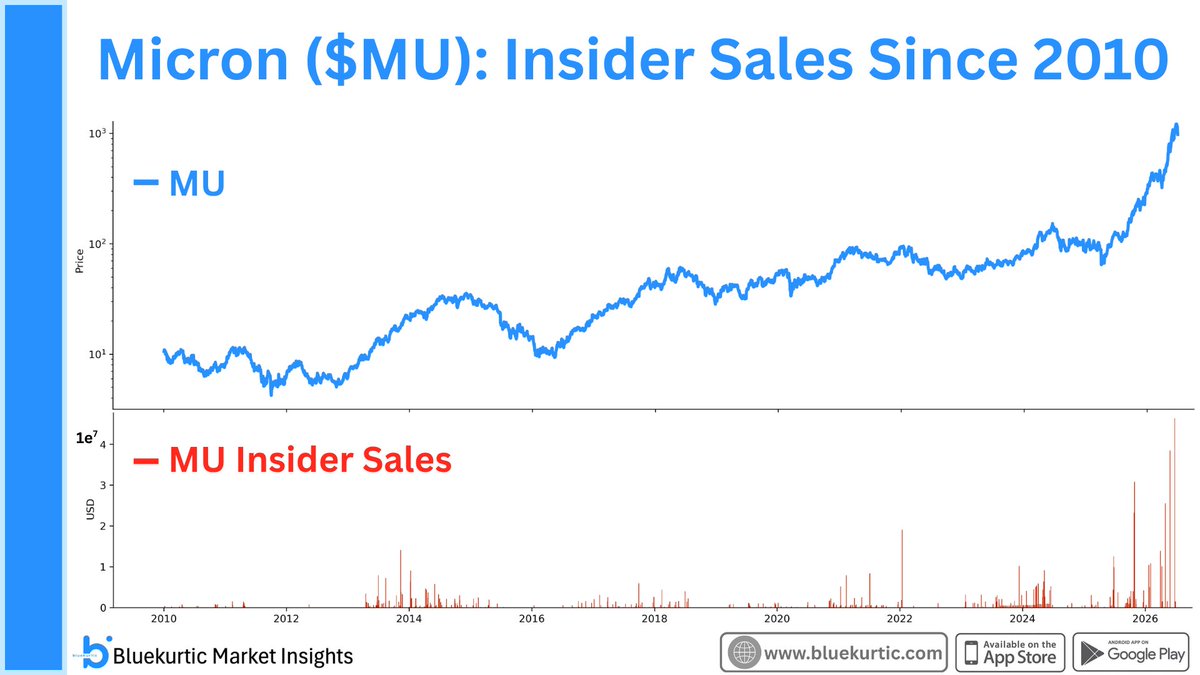
Insider sales aren't unusual, but this for Micron is worth watching.
$MU, the second-best performing S&P 500 stock YTD, is seeing insider selling at the highest level on record since 2010.
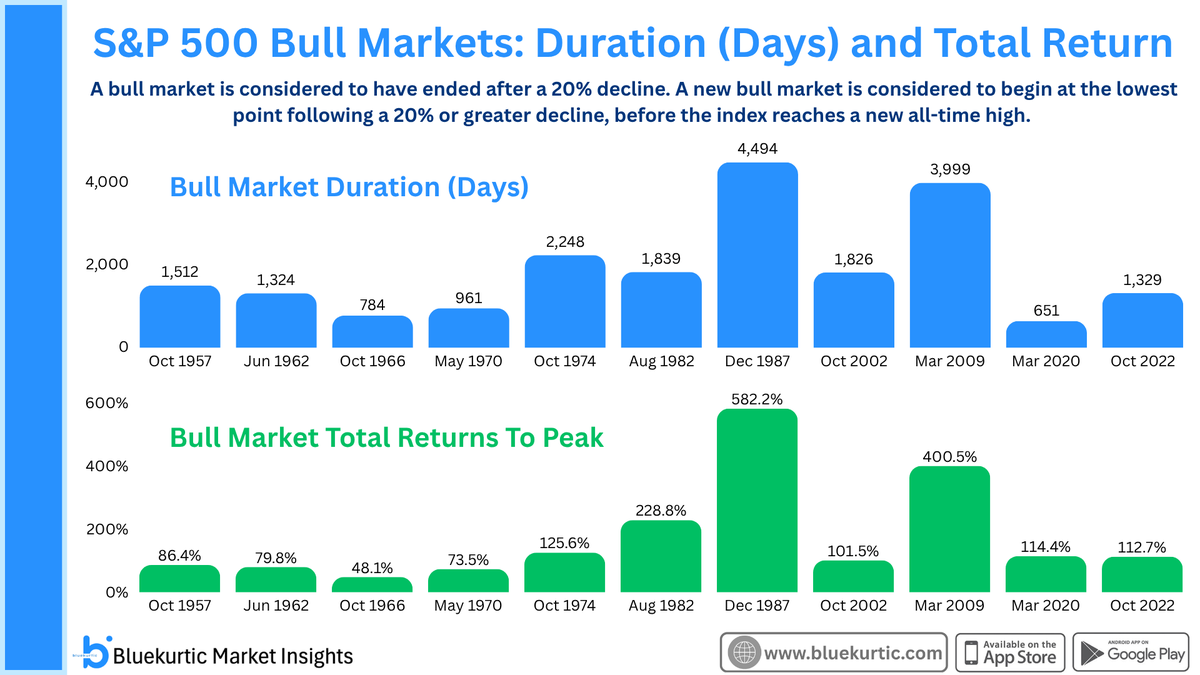
The current S&P 500 bull market is still only a teenager by historical standards.
At its peak, it is 1,329 days old and gained 113%, making it the 7th youngest bull market by duration and 6th by total return among the last 10 bull runs.
Latest AAII sentiment survey showed bears outnumbered bulls by 10.9%. Not something one typically sees at a market top.
Whenever a calendar year averaged more bears than bulls, following year was always positive.
2025 and 2026 (YTD) are on that list. See where this is going?
Underlying breadth is in favor of bulls for the month of July. More than 10.5% of S&P 500 stocks are posting net 52-week new highs for the first time in over 3 months.
In the prior 10 occurrences, the S&P 500 $SPX was higher 4 weeks later in 9 cases.
High yield credit spreads on our MI Dashboard (MI-Market Insights) were the only indicator that flashed a warning at the end of June.
They're narrowing again, but bulls should keep an eye on them. If spreads start widening again, it could be an early warning sign for S&P 500.
@GroupFinom@WarrenPies Agreed. Part of it may also have been quarter end portfolio rebalancing after 100%+ gains in some stocks, to bring portfolio weights back within risk limits. Add in some hedging ahead of the long weekend (can you really blame them?)
These shenanigans have occurred only around major market inflection points. S&P 500 low volatility gained over 1% while high momentum fell over than 2%.
Four of the last eight occurrences happened within the last 30 days. Something huge is building up.
Despite current weakness in the S&P 500 $SPX , our cross-asset breadth model has turned as bullish as it can get.
On June 30, all 7 of 7 indicators closed above their 50-day moving averages for the first time since October 2025. That's not the behavior of a weak market.