A fan of the book written by two National Academy members (@HastieTrevor, @robtibshirani) and two COPPS winners (@robtibshirani, @daniela_witten)? Love the second edition but still want more? Stay tuned for the next installment.
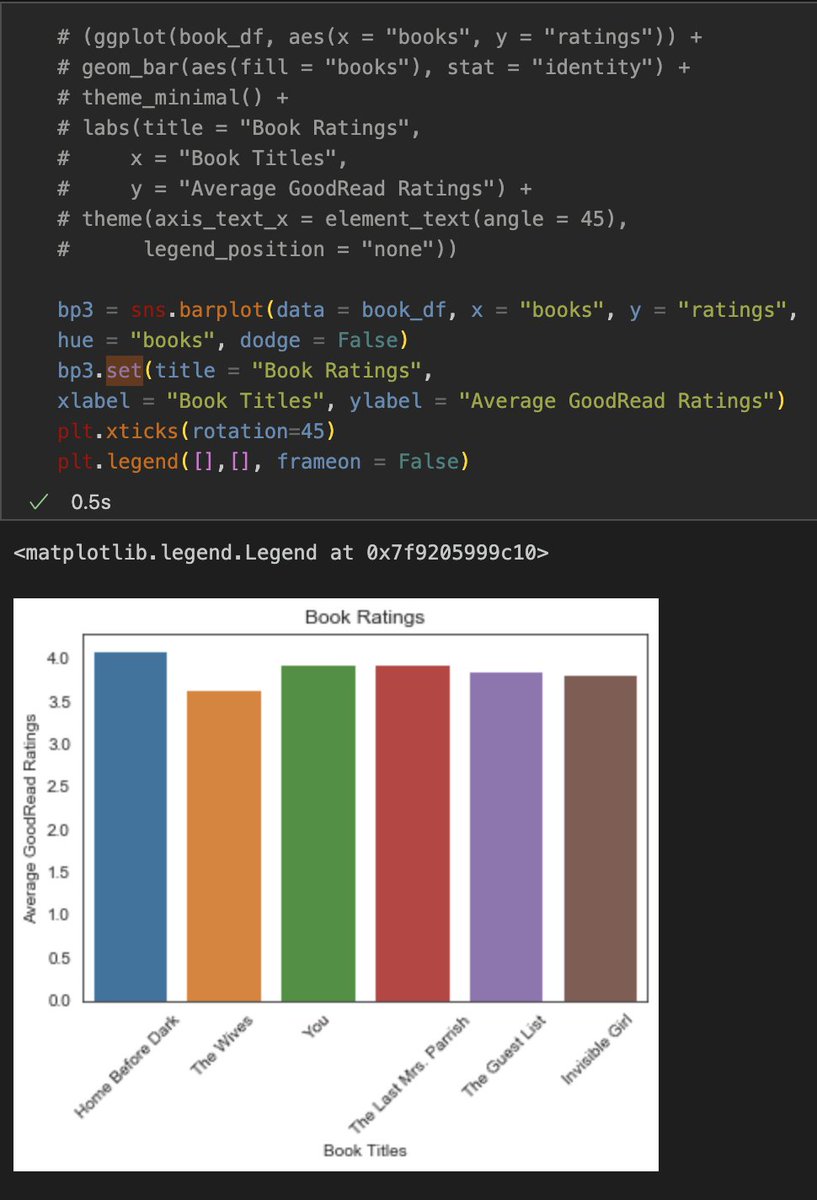
Started translating my 📊plotnine data viz lectures into 📈seaborn (so students can see both).
💭and I have some thoughts.
Here's the notebook with plotnine (commented out) and seaborn plots:
https://t.co/Z36rodGFUU
Bill Russell was one of the kindest, most thoughtful people I’ve ever met. Once called out of the blue because he thought I looked sad on TV…best pep talk of my life. RIP
Big news in #ggplot2 land (development version). A new aesthetic has landed: Meet "linewidth". Prior to this "size" was used to scale both area and width based traits, but those are two very different things and we are making amends now. #rstats
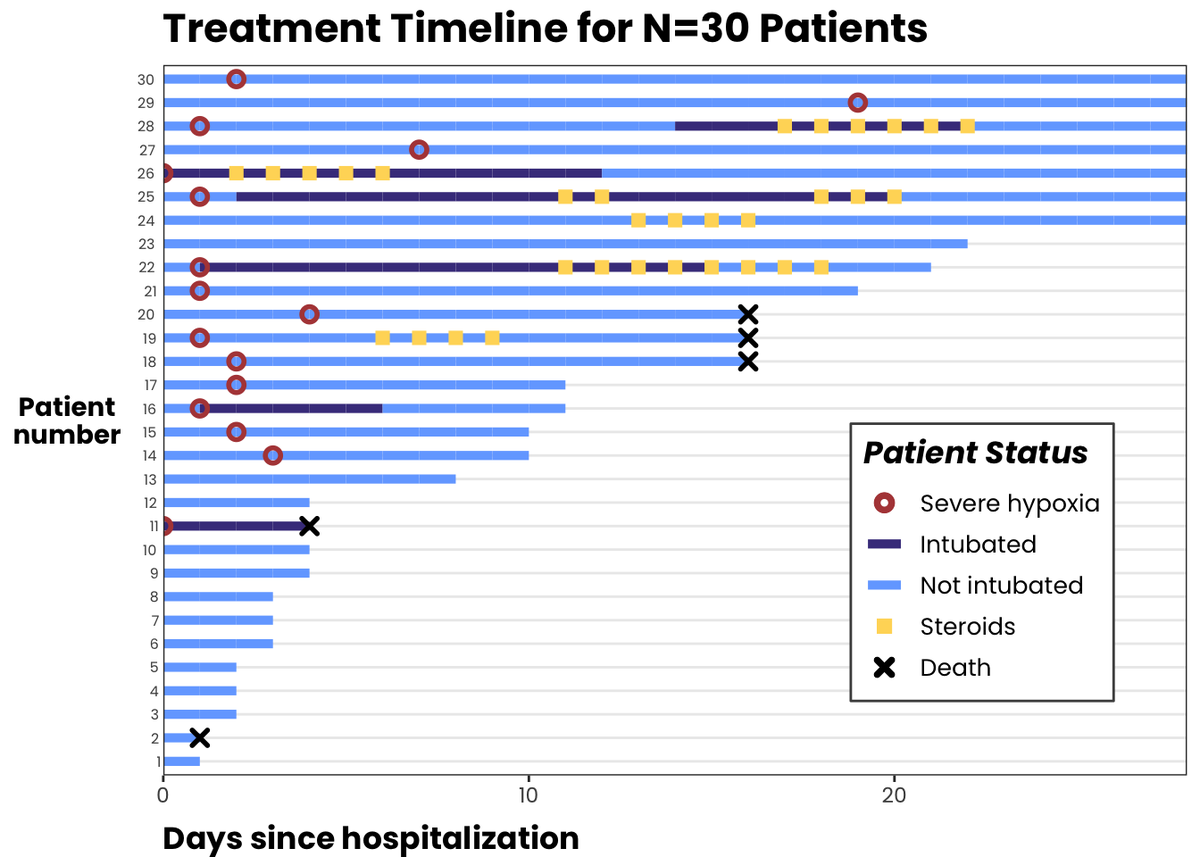
📣 new blog post! a step-by-step guide to making individual timelines or "swimmer plots" with multiple variables in R
🏊♀️➡️ https://t.co/MYpE7bSi6c #rstats#ggplot2#datascience
Lee Wilkinson is the reason that ggplot2 exists; not just because he wrote the Grammar of Graphics, but also because he was so kind and supportive to me when I was a young grad student thinking of trying to implement it. He will be missed.
After having explained how to read box plots to thousands of workshop participants, I now believe that this classic chart type is unnecessarily unintuitive, hard to grasp, and prone to misinterpretation. Explore some alternatives with me... https://t.co/psdUWx17dx
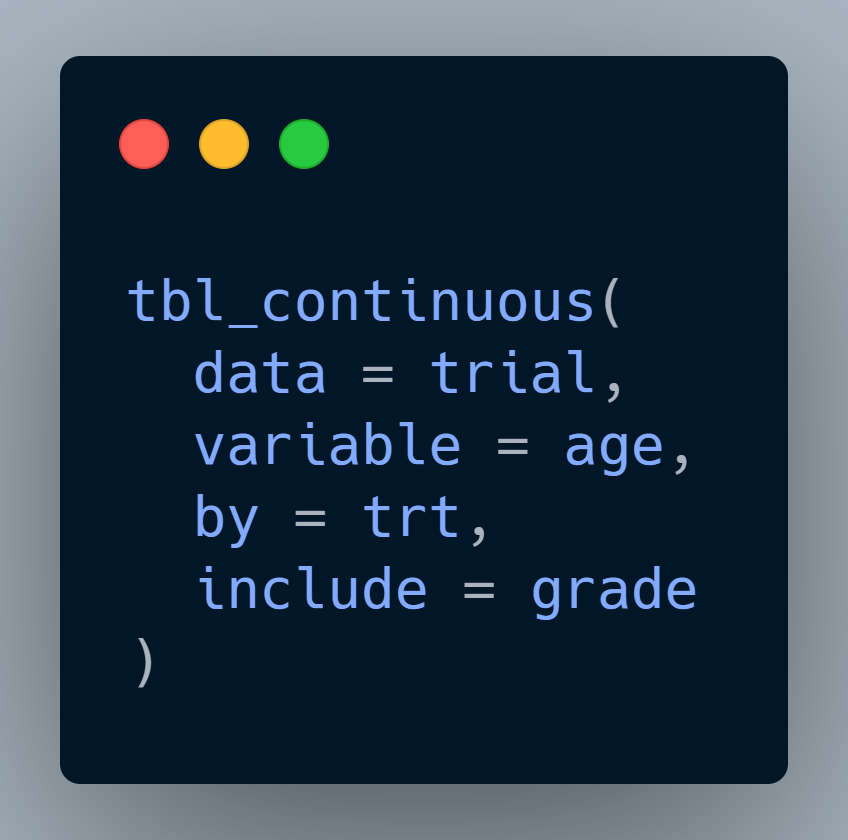
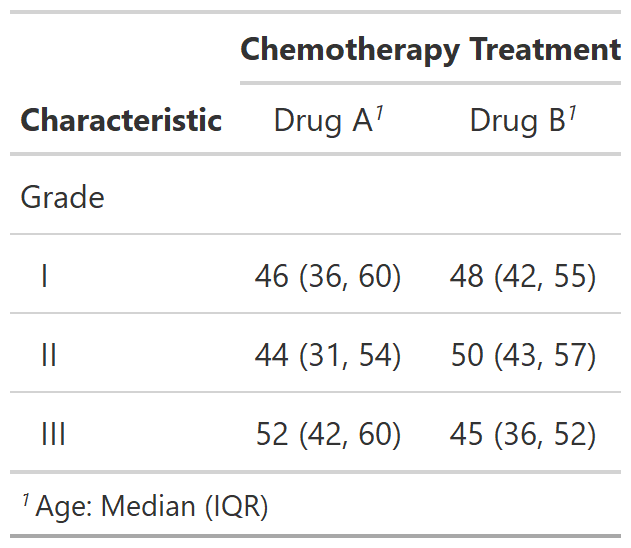
New #gtsummary function `tbl_continuous()` summarizes a single continuous variable by 1, 2, or more categorical variables!
This often-requested feature is now available https://t.co/DkXk3jU5TS
#rstats#datascience#gt#cran
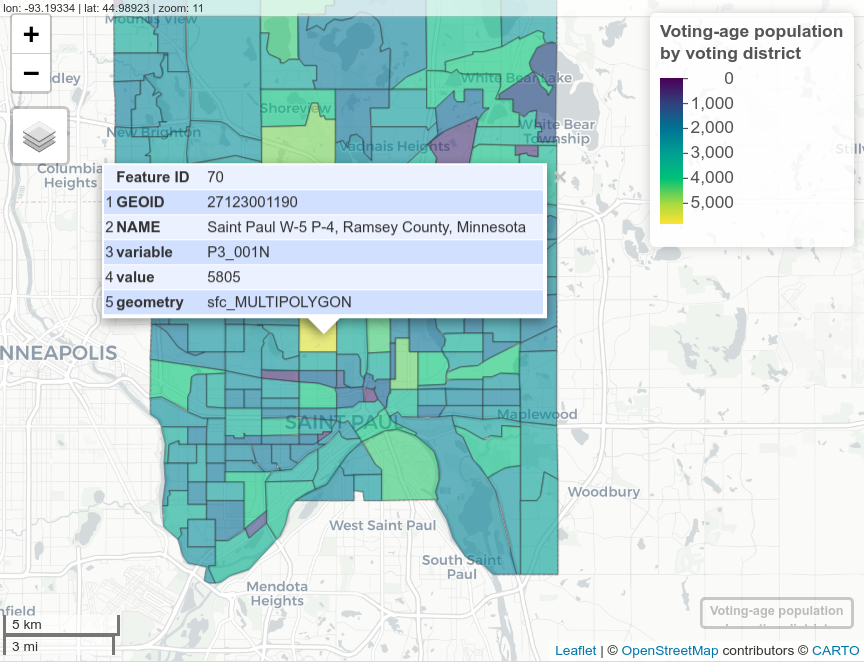
🚨 Two new #rstats package updates on CRAN🚨
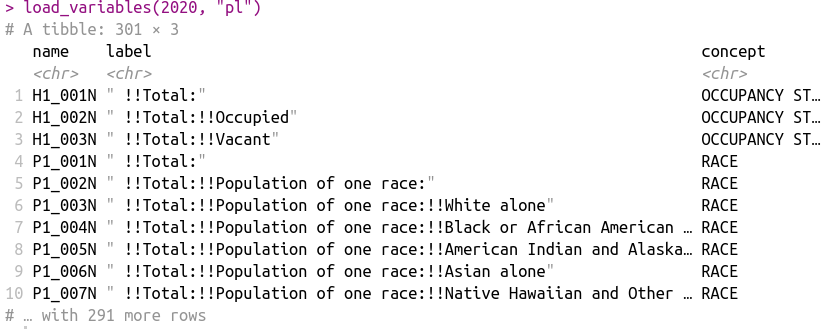
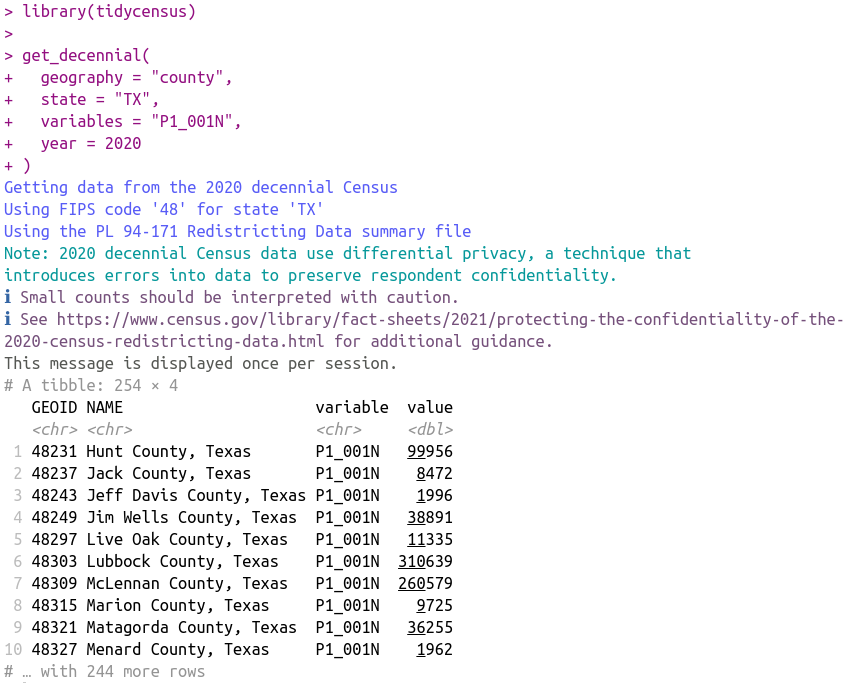
- tidycensus 1.1: Support for the new 2020 decennial @uscensusbureau redistricting data
- tigris 1.5: Support for all currently available 2020 shapes with `year = 2020`
Update both packages and start analyzing the new data!