Percentage of $BTC supply in profit at each bottom.
2012: 47.77%
2014: 42.23%
2019: 40.20%
2022: 47.98%
2026: 47.91%
Most people don't realize how close we are to the bottom.
The 30K calls are just like the 10K calls last cycle, everyone expected them, but they never came.
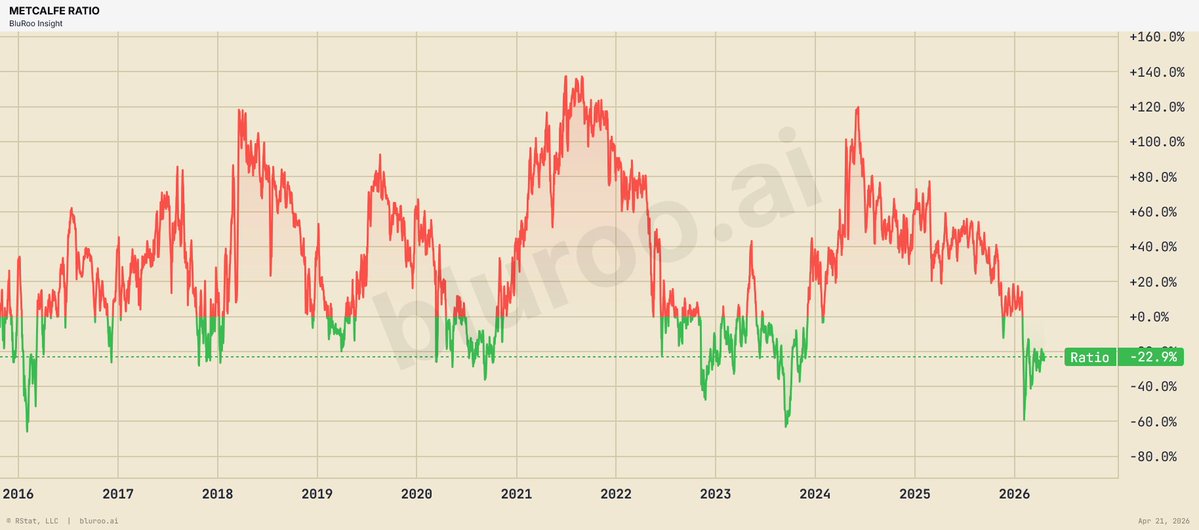
Bitcoin's Metcalfe value signaled the bottom was in early February. Since 2015, this was only the 3rd time Bitcoin was so undepriced relative to its network value. In both cases, Bitcoin rallied 60%+ within 6-9 months.
THE MONEY SUPPLY IS EXPANDING WHILE BITCOIN DIVERGES.
This exact setup has printed every single bear market.
And every single time after?
Bitcoin erased the divergence and exploded to new highs.
More dollars chasing fixed supply.
That’s not bearish.
That’s the most bullish divergence in finance.
While everyone panics…
The money printer is quietly building the next rocket fuel.
Same story. Same setup. Same result.
Now you see it before it happens.
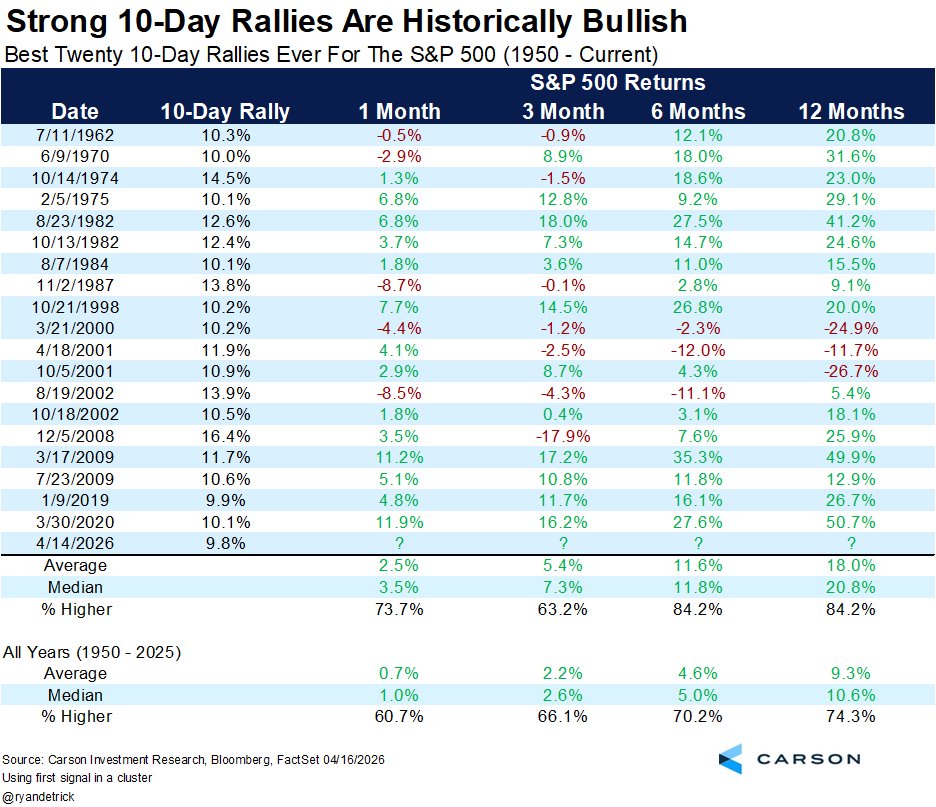
The S&P 500 just posted a 9.8% 10-day rally, one of the greatest ever recorded. Bears say big moves like this are dangerous. History says otherwise.
Looking at the top 20 10-day rallies since 1950, the S&P was higher 12 months later 84% of the time, averaging an 18% gain.
🧵
Just to make a point, for the bears who want to see $40k.
You may well end up right.
However, consider that on a mean reversion basis, averaging relative to nine anchors (a mix of technical, onchain, trend, fast, slow etc), it is a Q 0.4 event.
Lower than $2 Bitcoin in 2011.
Update: Bitcoin bounced out of oversold, rallying against Gold.
Every time this has happened in Bitcoin's history, it was the start of a 2+ year bull market.
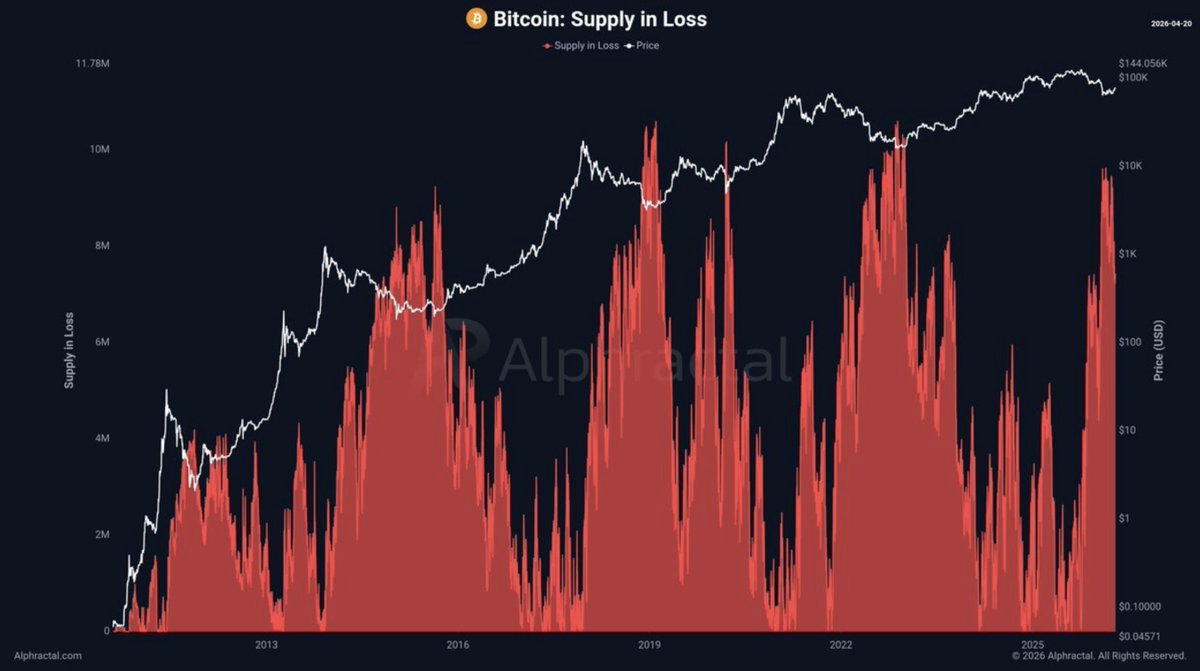
LONG TERM HOLDERS ARE QUIETLY WINNING THIS CYCLE. 🚨
Since the 2018 bottom supply in loss has been shrinking every single cycle.
Less pain each time. Less capitulation each time.
Less opportunity to buy cheap each time.
The window where long term holders accumulate at a loss is getting smaller.
Every cycle that passes...
Fewer coins are available at distressed prices.
The ones who understood this in 2018 never looked back.
The ones who understand it now...
Are loading up before the window closes completely.
THIS IS ABSOLUTELY UNBELIEVABLE
Over the past 13 years, Bitcoin has followed a consistent timing pattern in both bear and bull markets.
Bear markets last around 406 days
Bull markets last around 1,064 days
The current downtrend has lasted about 210 days so far, roughly halfway through the usual cycle.
This time might be different from what majority expects.
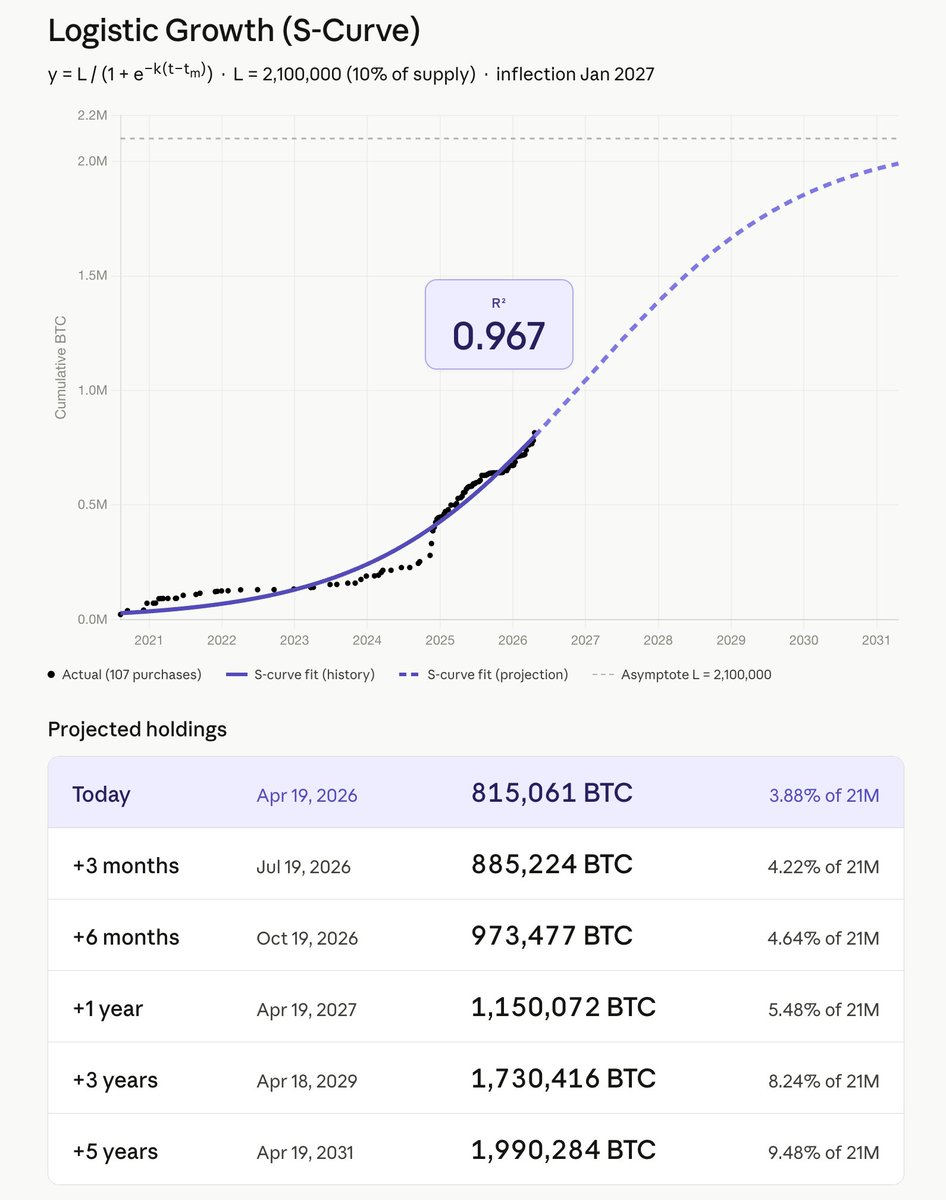
Michael Saylor said he will exponentially slow down his buys once they reach 7.5%.
That's the top of an S-curve.
Once past the inflection point, the rate of change decays exponentially as the curve flattens toward its ceiling.
He literally just described my model.
A $2.1M ceiling would be poetic.
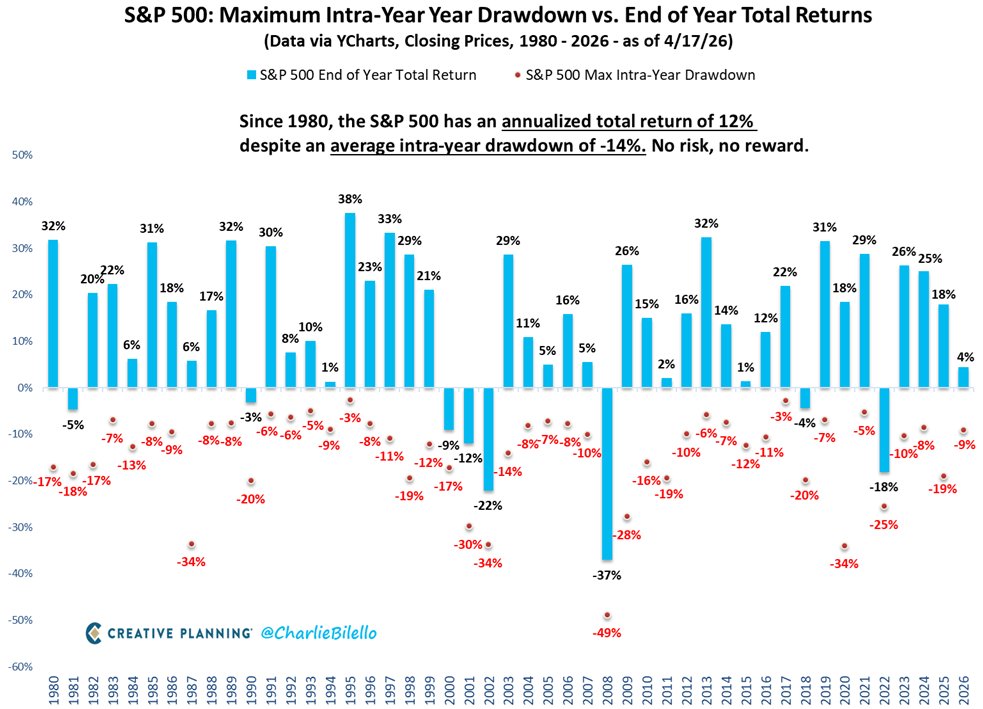
The S&P 500 has returned an average of 12% per year since 1980 and has done so despite an average intra-year drawdown of 14%, and often drawdowns that are much worse.
The lesson? Volatility doesn’t equal a permanent financial loss unless you sell.