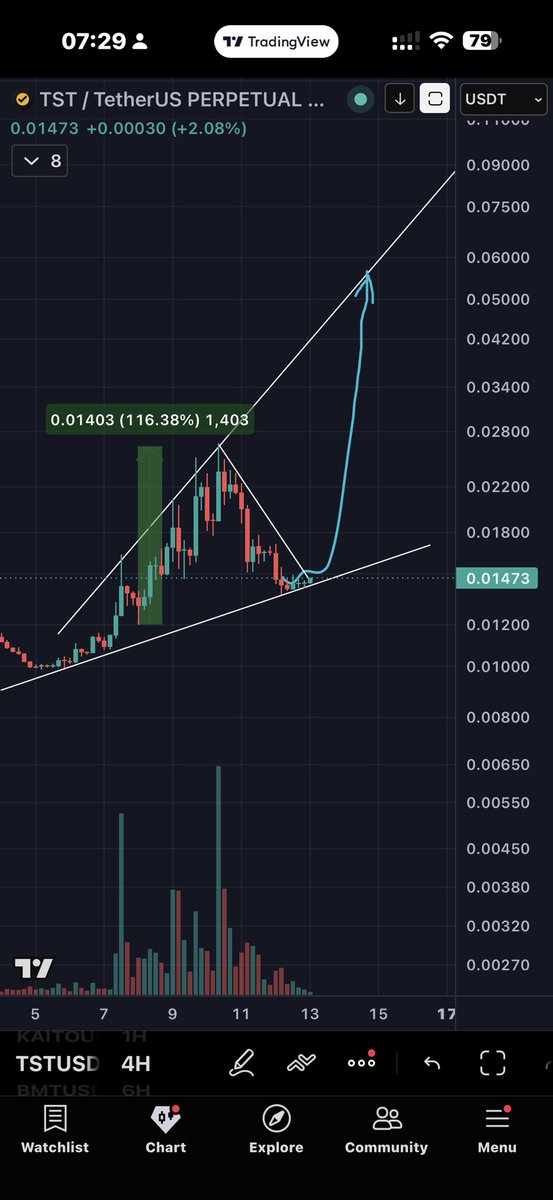
open Long #TST
📌 Sharing personal opinions only — not financial advice or a recommendation to buy/sell. Crypto is highly risky; DYOR and you are solely responsible. No coin promotion.
Yeah, looks like Wyckoff to me. The real question is whether it’s Schematic #2 (bottom is already in) or Schematic #1 (one more sweep).
What do you think? I’m voting for Schematic #2.
$BTC #Bitcoin
$NEAR has already completed Phase 1:
destroy almost everyone who believed in it.
From the $20.49 ATH to below $1 - roughly a 95% collapse.
Four years of pain, failed rallies, and enough time for the market to completely lose interest.
Now comes the part I care about: Phase 2.
$NEAR is sitting around $1.65, while the chart is building from the same long-term bottom zone that has repeatedly produced major expansions.
If this cycle turns, I’m not looking for a cute 50% bounce.
The previous ATH around $20 becomes the obvious magnet first, and the larger expansion on this structure points toward $27–30.
That’s roughly +2,800% from the cycle low.
Sounds stupid when $NEAR is near $1.
It’ll sound much smarter at $10 when everyone starts posting ecosystem threads again.
Crypto has a funny way of making the cheapest prices look terrifying and the expensive ones look safe.
Phase 1 was survival. Phase 2 is where things could get interesting.
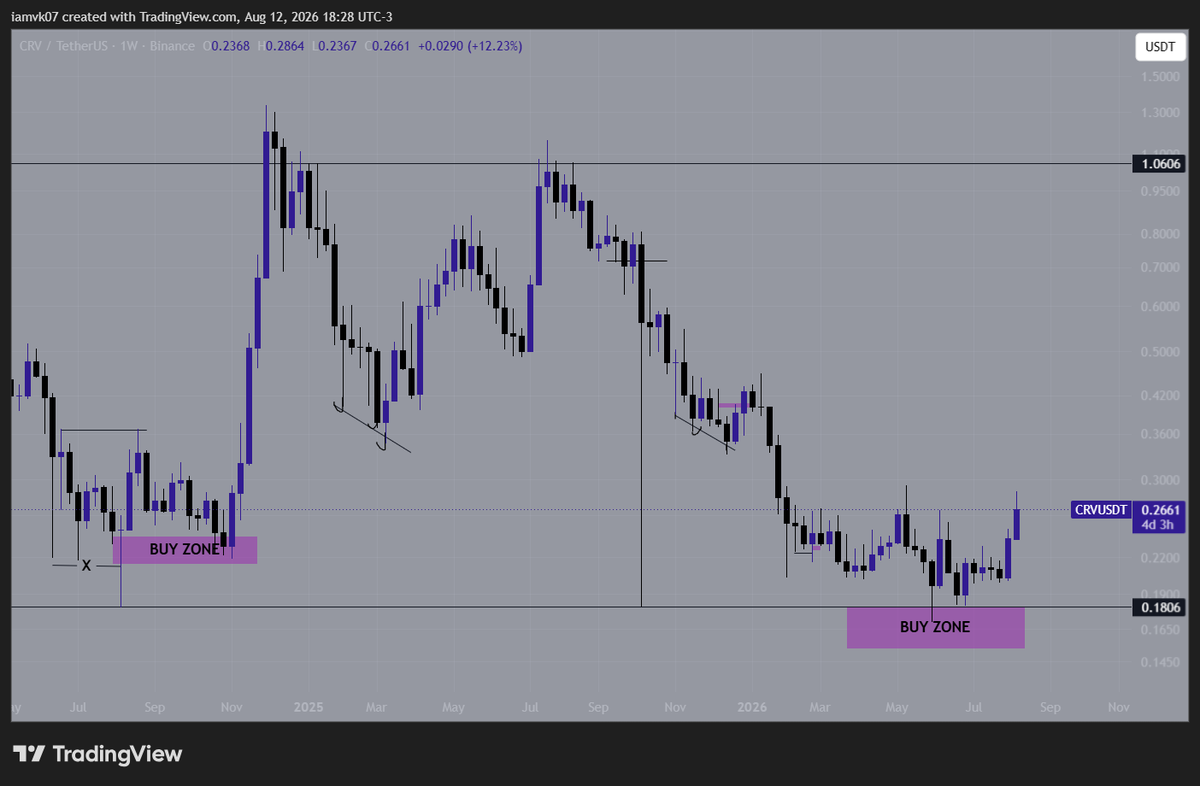
ethereum:0xd533a949740bb3306d119cc777fa900ba034cd52 is about to have its moment! 😍
Been tracking #CRV scalp trade for a WHILE! It's now leading the altcoin market and about to cross its FIRST macro .118 resistance at .287!
REALLY excited to capture the momentum off that break and trade #CRV first Wave 3 of the new trend. My plan is to take profit at the NEXT macro resistance (.236) at $.40. I think it is possible for this wave to extend further as high as $.44+! Just the beginning of something really exciting!
Who's taking this trade with me??
$4 is forming a clean rounding bottom👀🔥
Great risk/reward setup with 2–5X potential if the breakout confirms
The key level to watch is resistance trendline. A clean breakout and successful retest could open the door for the next major move🚀
🎯 $50M+ market cap is knocking👈
I called the $SPCX short in the Subscriber Zone from the 140 rejection zone, which dropped all the way to 131. I took this trade myself, it’s one of my absolute favorite tickers for both longs and shorts simultaneously.
I’ll keep playing both longs and shorts on #SPCX until it hits the $820 zone.
If you can't handle short calls, I won't share them publicly online anymore, it'll only mess with your head and wreck your focus.
But let me be clear- Shorting is NOT for newbies. If you don't know how to identify a reversal candle or measure volume to close a short instantly, stay away. Execution speed matters in shorts trade.
https://t.co/gzYUxGB5T8
The ideal moment to be positioning yourself into $ETH is literally right now.
Everybody is waiting for that ultimate confirmation, but that never comes.
It's always awkward to be positioning yourself into a position as that's the purpose of the markets.
Previous breakouts of the markets have resulted into generally big returns as $ETH is known for volatile movements.
In that sense, last time a 60% breakout in less than a week took place. In 2023 the same has happened.
I wouldn't be surprised we're going to be seeing the exact same thing in the next months, a rally to $3,000 in a matter of days/week.
How are you going to position after that? Yes, that's quite hard.
That's why allocating here is the right strategy.
$HYPE added to my watchlist, as you can see it is trying to break out of the downtrend, with the 57.8/56 lvl still acting as res, once this would be flipped i'd position myself long
Pretty easy R/R on $DOGE here IMO.
Straightforward invalidation, clean range for higher targets. Lets see if OG memes that plumbers traded can catch a bid.
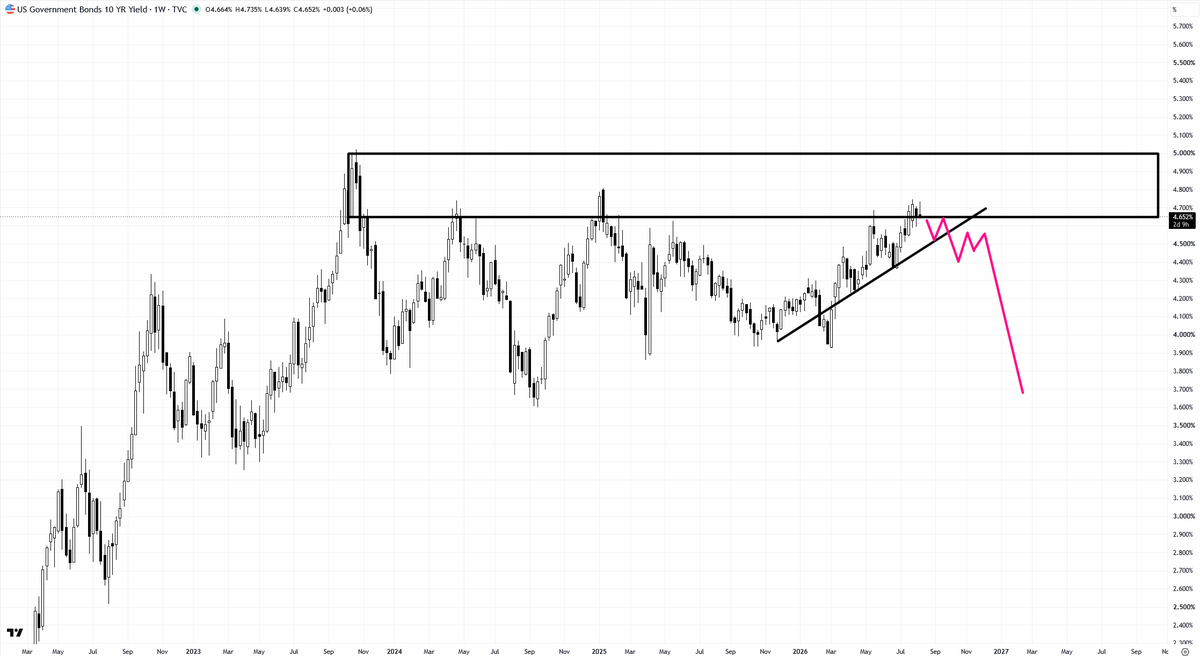
US 10Y bon yields showing weekly resistance
Expecting the FED to drop the rates which will push the bonds lower
We may not get a drop in rates this month but it'll come soon
Resistance is still resistance
$SUI looks boring right now.
Good.
That’s usually when I start paying attention.
The chart has spent months bleeding back into the same massive liquidity zone where the previous expansion started.
But here’s the interesting part: every major $SUI pump has historically pushed toward this rising trendline.
Pump 1 → ~$3.
Pump 2 → ~$6.
Pump 3?
If the pattern repeats, that trendline sits somewhere around $13–14.
From $0.68, that sounds completely insane.
But remember: $SUI already went from below $1 to $5 once while everyone was waiting for a “better entry.”
Now sentiment is dead again, price is back near the floor, and nobody wants to touch it.
Exactly the kind of setup crypto loves.
I’m not saying $14 tomorrow.
I’m saying if $SUI wakes up again, $0.68 is going to look very different in hindsight.
$TIA is either completely dead…
or sitting at the beginning of one of the nastiest comeback trades in crypto.
At $0.30, the market has basically priced Celestia like nobody will ever care again.
And that’s exactly why this chart gets interesting.
There are three levels I’m watching:
$2.25 - first real break of structure.
$9.29 - the level where the comeback becomes impossible to ignore.
$21 - previous ATH territory.
From the current zone to ATH?
Roughly +4,300%.
Obviously, $TIA doesn’t teleport there. It needs to reclaim every major level and prove the structure is actually changing.
But that’s the funny part about crypto.
At $20 everyone wanted $TIA.
At $0.30 nobody wants to touch it.
If the pump phase actually begins, people will somehow rediscover the fundamentals at $5.
I’d rather watch the chart before the narrative comes back.