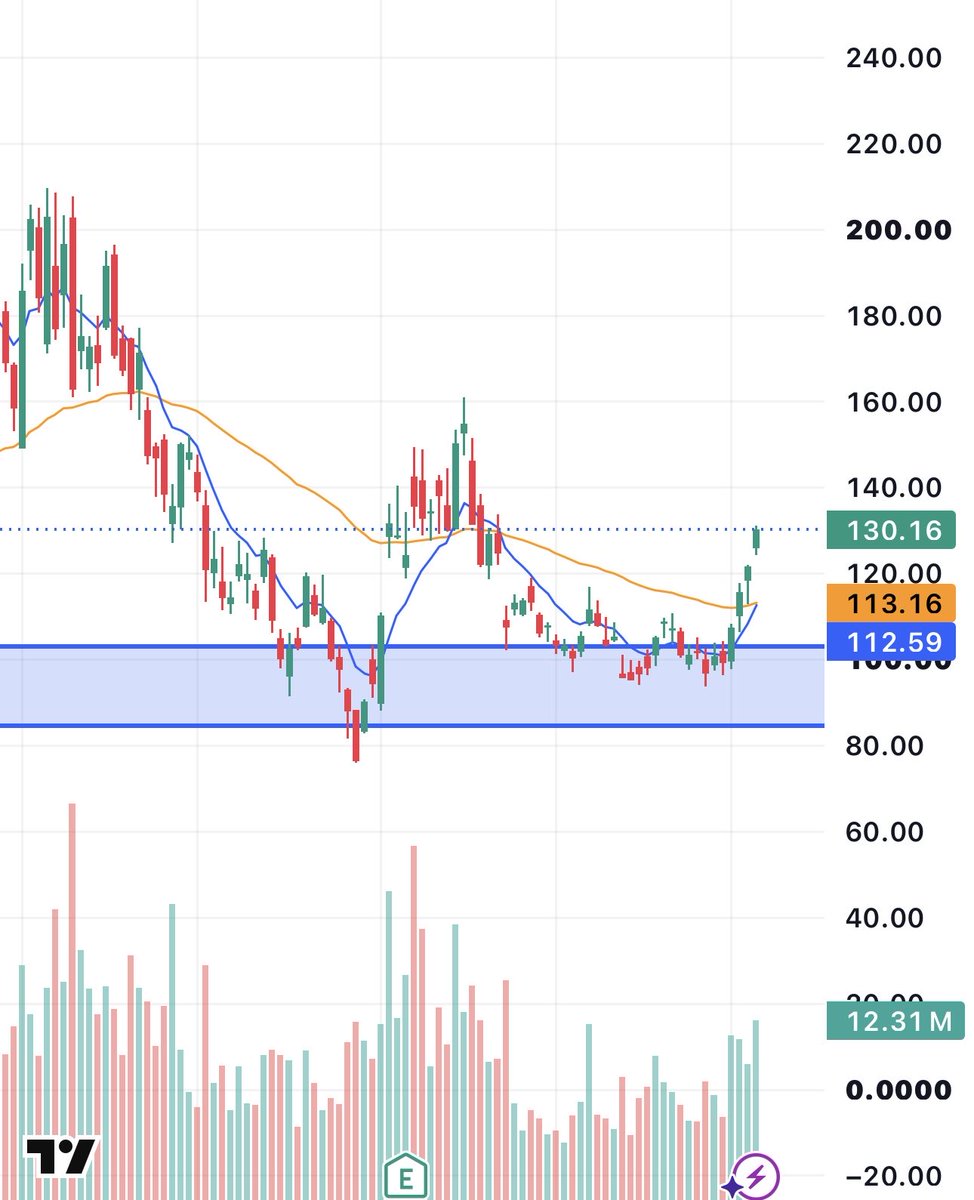
$AAOI
Almost got the 10% day we were looking for
9/50EMAs are closing in on the bullish cross
Doesn’t get much cleaner than this, plenty of room to $150+
*Updated 15 October 2026 $AAOI
Current: 78.02 (low 77.05 this session)
RSI (15-min): 21
Structure update
WXY (is my bias)
- Y has extended. Price is now testing the July low zone (76.01).
- 88% retrace of the X rally (76.01→160.99) was 94; price is now well through that and approaching the 100% reversal at 76.01.
- No new five-wave impulse has formed on the decline. Swing structure remains corrective (good news)
-We have no good news as of yet on RSI (I'm looking for a positive reversal to get long).
Wave 2 alt bias
- Still alive only if 76.01 holds on a closing basis.
- A daily/weekly close below 76.01 invalidats the “Wave 2 of a new impulse” count and strengthens my larger Y / unfinished correction case.
---
Decision levels (updated)
$72 - Next measured (4H AB=CD) | First target if 76 fails
$64–66 | 0.618 of W | Primary measured Y zone |
Time cluster
- My time correction clusters at a recovery occurring anytime between today and Nov 15, Gann says not until Oct 27
- Hurst says the The 3-month cycle is EXTRMELY OVERSOLD and overdue.
For the good news. On longer time frames I see $278-$298 playing out. We have confluence with Fibonnacci and Carney Harmonics on the 1M, 3M and possibly even the weekly. That D leg will need to be recalculated if we breach $76.00.
My trade rules don't allow me to take anything other than a scalp right now in $AAOI I see no signs of a bullish reversal yet. $AAOI $AAOX
Distribution ranges are proportional to the size of the markup phase at a ratio of roughly 10:1
The bigger the rally, the bigger the range.
One of the biggest mistakes traders make is confusing these large price swings with the start of a new trend.
Using the $AAOI chart as an example.
Distribution ranges are proportional to the size of the markup phase at a ratio of roughly 10:1
The bigger the rally, the bigger the range.
One of the biggest mistakes traders make is confusing these large price swings with the start of a new trend.
Using the $AAOI chart as an example.