Enough people have asked me so here it is
I am NOT confident in this yet, it needs more refinement and forward testing
As a short term index algo it is likely very sensitive to regime changes
If you improve it, please share
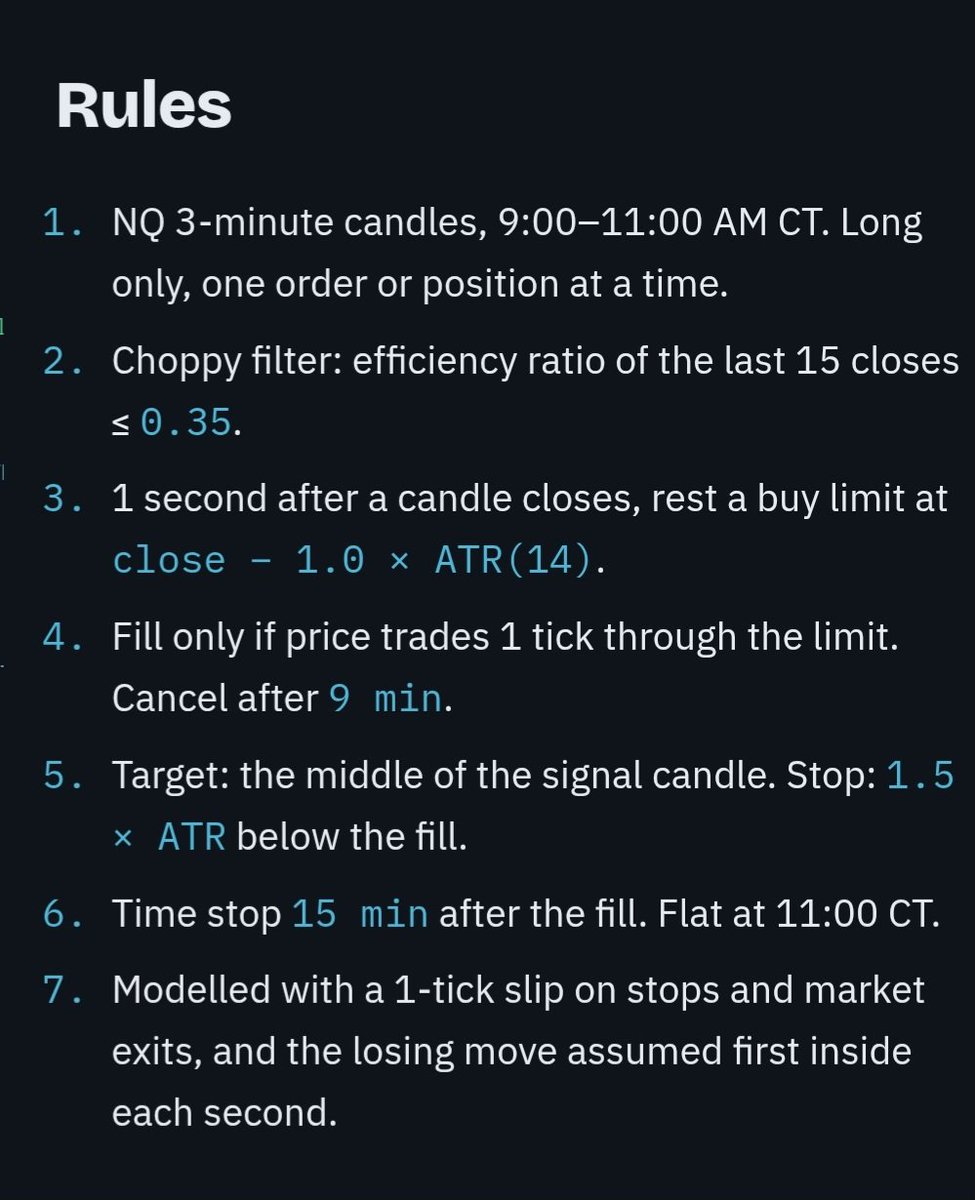
Try it on 3 minute candles, 1 second data in NT8
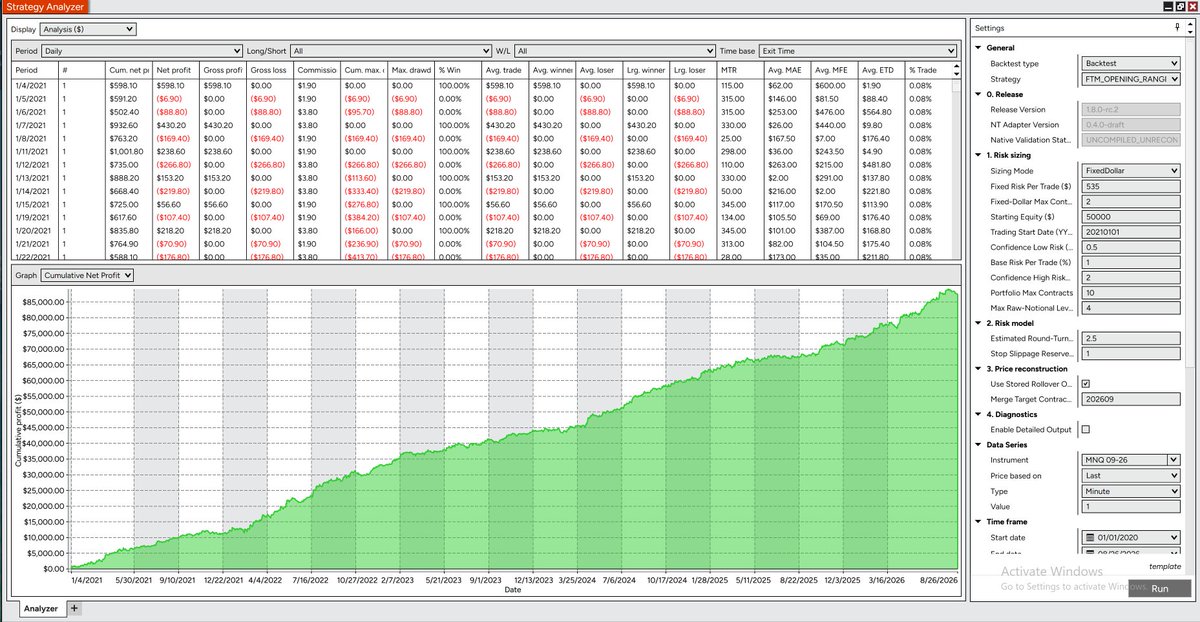
My ORB MNQ strategy for NT8. It uses 1min charts for data, but trades based on 15min break outs. 1 trade per day. 3 different risk profiles.
IS - 2020-2024
OOS - 2025+
https://t.co/wytpJx8pn3 - strategy
https://t.co/0os08GInYS - readme
What have I been cooking?
$MGC 5m double orb break with entry at 0.3
Didn't have the nuts to enter today, but getting comfortable with the concept.
This is in addition to the IB, not hopping strategies.
Something is here in the @edgeful data, I just need to flip the switch.
Was able to replicate this -- great work @etbent1!
His 2 changes made the strategy much better:
- Profit factor = 1.86 --> 2.73
- Win rate = 59% --> 64%
- Return / DD = 8.7x --> 16.1x
- 2026 YTD (1 NQ) = $55K --> $53K
The ORB 1:1 RR is CRAZY
Mark the range formed between 9:30AM – 9:45AM EST (Opening range / ORB)
• If the ORB low forms first → target the ORB high
What is ORB?
ORB = opening range breakout (the first 15 min candle of New York Open)
6 months NQ Stats via @edgeful
• ORB low forms first + aggressive buying
→ 78% probability of sweeping the high
🚨EL WEB SCRAPING HA MUERTO🚨
Han creado PixelRAG.
Un sistema open source que pasa de parsear HTML.
En vez de convertir una web en texto...
hace una captura de pantalla.
Y luego un modelo vision-language lee la respuesta directamente desde los píxeles.
Brutal.
Porque el scraping tradicional rompe muchísima información:
→ tablas
→ gráficos
→ layouts
→ columnas
→ botones
→ PDFs
→ páginas mal estructuradas
Todo eso se pierde cuando conviertes una web en texto plano.
PixelRAG hace algo mucho más simple:
indexa la página tal y como la ve una persona.
El equipo ha creado un índice visual de Wikipedia entero:
+30 millones de screenshots.
Y aun así supera al mejor RAG basado en texto por un 18,1% en QA.
Tiene también un plugin para Claude Code.
Básicamente le da ojos a Claude.
Le pasas una URL, un paper de arXiv o tu web local…
y Claude no scrapea el DOM.
La mira.
Cómo funciona:
→ renderiza webs, PDFs e imágenes en tiles
→ los embebe con Qwen3-VL-Embedding
→ construye un índice FAISS
→ busca visualmente sobre píxeles
Todo open source bajo Apache-2.0.
Link al repo en los comentarios 👇🏻
HOW I MADE 43.33% SO FAR !
( This may change your Algo-Trading game forever )
Many traders didn't make it the last months due to geopolitical events, especially Hurmoz-block, they got highly exposed to markets especially USDJPY !
While My risk management Sub-brain handled that Professionally !
The moment OIL's ROC% rose, this institutional level small system inside, is aware abt the high uncorrelation between the YEN VS OIL , it eliminated the idea of selling USDJPY and reduced the risk on buying !
-Pure switching-regime detector that adapts to any kind of markets conditions ....! Through risk and asset allocation , cross market correlation and a real risk distribution according to VIX and markets volatility.
Signal Sigma ... Meet Claude.
Andrei's update to the Signal Sigma charting platform is ... fire. Lit.
The process actually IS as easy as Andrei demos (quoted link below).
So ... I tried it out.
I do exactly what Andrei said in the vid.
I chose QQQ as my asset ... added Total GEX to the subgraph ... exported the data. (This took ... like 2 minutes my first go. Maybe less.)
Then I uploaded the Signal Sigma chart and the exported data to Claude ... and told Claude to find buy and sell signals from the exported CSV ... tell me how he arrived at them ... and calculate returns for the trades they marked.
The results of this simple test of Andrei's new implementation ... handed off to Claude ... produced this (full narrative with strategy):
https://t.co/jb1lFFrCZg
Mike drop.
Free trials of @Signal_Sigma still available:
Click here https://t.co/ukahpK0bvE
The Simplest NQ Strategy for Beginners
Mark the range formed between 9:30 AM – 10:30 AM EST (Initial Balance / IB)
• If the IB High forms first
and IB closes between 0 to 0.25 of the range → target the IB Low
• If the IB Low forms first
and IB closes between 0 to 0.25 of the range → target the IB High
What is IB?
IB = Initial Balance (the first hour of New York Open)
📊 1 Year NQ Stats via @edgeful
• IB High forms first + close between 0–0.25
→ 84.48% probability of sweeping the low
• IB Low forms first + close between 0–0.25
→ 92.13% probability of sweeping the high
Simple, Clean, Statistical edge.
ATR is in every single strategy we run at the hedge fund. Most traders treat it as a stop loss tool and nothing else. They're leaving two-thirds of its value on the table. Here's the full picture.
We use ATR three different ways, and the combination is what makes it work.
For entries: take the open of the bar, add ATR(20) multiplied by 2.5, and you've got a precise breakout entry level. Not "it looks like it's breaking out." A calculated price that either gets hit or it doesn't.
As a filter: compare ATR(5) against ATR(20). When the short-term reading is expanding relative to the long-term one, the market is waking up. When it's contracting, the market is chopping. Sit out. One comparison, and you cut a huge number of false breakouts.
For exits: flip the entry logic. Use ATR multiplied by a fraction to set your stop loss distance. The market tells you how much room the trade needs based on what's actually happening right now.
One indicator doing three jobs: Entry, filter, exit. A complete strategy.
Most traders pick one of these and ignore the other two.
They'll use ATR for stops but calculate entries with something else entirely. Or use it for entries but never filter with it.
The real edge comes from letting it handle all three, because ATR is measuring the same thing across all three decisions: how much the market is actually moving.