Impressive and full-featured app for visualization + sonification (which is also freely available!) from @Highcharts and Bruce Walker’s group at Georgia Tech. Check it out: https://t.co/TQvtsOBsL6
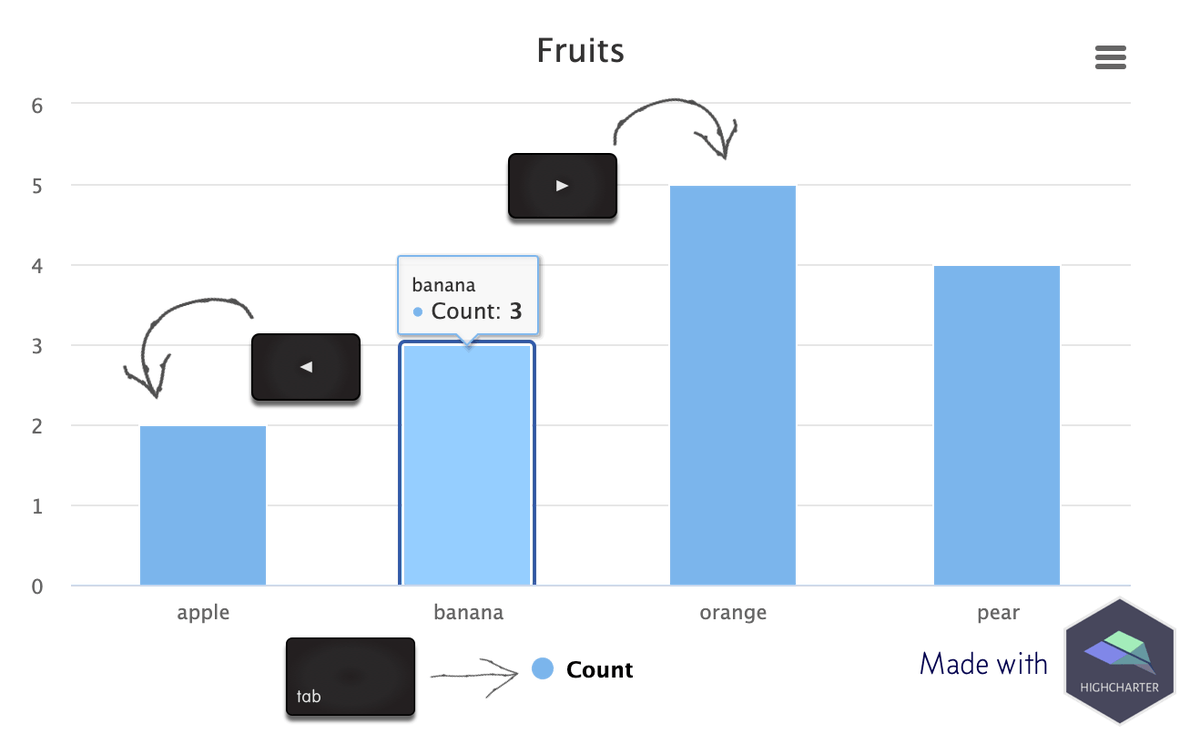
Me and @tedgies1 will be presenting at #CSUNATC22 in a week or so, talking about accessibility for scatter plots (especially big datasets), as well as drill down interactivity in charts. We're pretty friendly so please come talk to us!
@ed_edwardson @FrankElavsky @Highcharts We are currently using a combination of SVG and HTML, and will continue to tweak this balance more in the future. For charts we will always recommend giving access to a combination of modalities, including a plain old HTML data table & a text description.
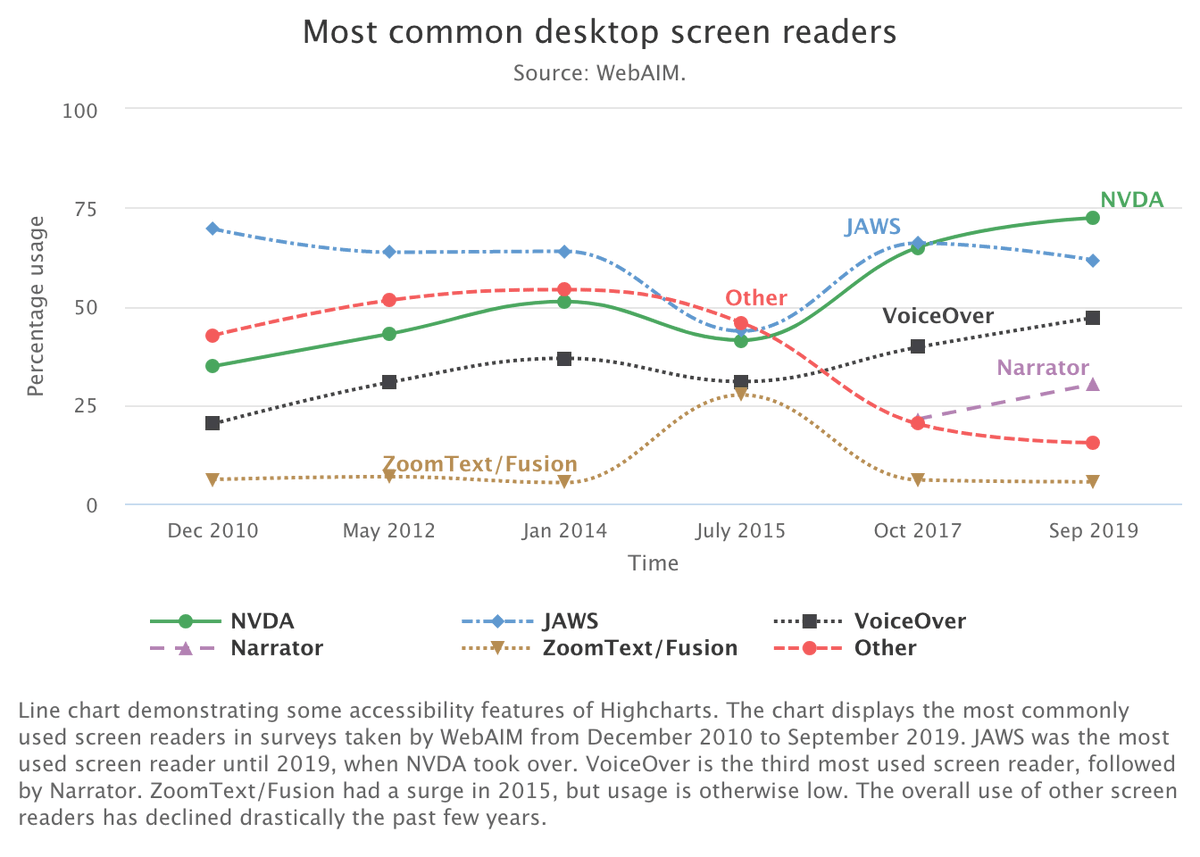
@ed_edwardson @FrankElavsky @Highcharts Thanks for the shout-out @FrankElavsky! From our testing, some things have definitely improved the past years - e.g. support for the WAI-ARIA Graphics module (https://t.co/F2krEfJha5), and some have actually deteriorated (looking at you NVDA).
Inspired by @spcanelon R-data-viz-accessibility collection (https://t.co/5GhPWltQTg), I've done a series of posts on using the @Highcharts accessibility module w/ @jbkunst's 💖 {highcharter} package:
https://t.co/rjkBqduBD1 #rstats#dataviz
@brucel Awesome! I know many artists incorporate sonification in their music, so if you're feeling experimental I am sure there is some fun to be had there!
@brucel Loud guitarist mostly here, measured in dB/neighbour complaints! Somehow never heard of Årabrot, I have some research to do! I see you are a musician as well?
@brucel@bruce_walker's sonification lab at @GeorgiaTech has a lot of research. In our experience it can be useful, but more complex sonifications require more training, and it won't be intuitive to everyone. Best not relied upon as the only modality, but a powerful tool in many cases
Did you miss the live conversation about accessibility and data visualization?
The recording is up! https://t.co/4sD6IMDWjV
Thank you panelists @oysteinmoseng@liatrisbian @FrankElavsky & @LeonieWatson for sharing your insights and moderator @AmyCesal for leading the discussion
The next fireside chat is about Accessibility of Data Visualization on Wednesday July 28th
https://t.co/7RiBdKxy9R
Panelists: @oysteinmoseng@liatrisbian @FrankElavsky & @LeonieWatson Moderated by @AmyCesal
🤔Do you know how to make charts accessible? If not, read Elsevier's and Highcharts' new standards for chart accessibility 👉 https://t.co/YYshYkhumF
#accessibility#chart
Join us tomorrow Nov 12 at 12PM ET for our #BbAlly office hours to hear about #accessible graphs and #dataviz from @Highcharts. We used @Highcharts to create our state-by-state #accessibility visualizations on https://t.co/alD0XDqA52.
Meeting details:
https://t.co/J9v3xedYDm
@FrankElavsky @Highcharts@amcharts Great writeup! And indeed our semantics are a result of coming to the same conclusion as Doug, that a role+tabindex+aria-label on the individual elements gave us the most robust behavior across AT and browsers.