The paper that I have been writing on the 1930s “Dust Bowl” drought, its causes, and historical significance / context is now complete. We are in the process now of editing the draft and making sure it is bulletproof. We are going to seek publication. Hopefully, I will have more news soon, and when I get that news, y'all will be the second to know.
Why does no one care?
In Africa, Arab Muslims are enslaving black African Christians.
The media, progressives, Palestinian protesters, the UN, and even the Pope remain silent.
𝗡𝗼 𝗪𝗶𝗻𝗱❓ 𝗡𝗼 𝗦𝘂𝗻❓ 𝗪𝗵𝗮𝘁 𝗖𝗼𝘂𝗹𝗱 𝗣𝗼𝘀𝘀𝗶𝗯𝗹𝘆 𝗚𝗼 𝗪𝗿𝗼𝗻𝗴❓
Britain begged the EU to relax import caps so it could import 2.3 GW of emergency power during the record heatwave. Solar output tanked as panels struggled in the heat. That electricity came from coal and gas plants in the Netherlands. What will happen when those plants are closed for good?
Read the full article:
https://t.co/7egLuM8WPm
A major heatwave will begin next week across the central and eastern U.S.
High temperatures in the 90s and 100s are likely as far north as Southeastern Pennsylvania. So, summer basically lol.
Undoubtedly, there’ll be plenty climate hysteria to go around.
But neither the number of hot days nor heatwaves have increased in the U.S. since 1895.
The chart on the left shows the average annual number of days reaching 95°F (35°C), 100°F (37.8°C) and 105°F (40.6°C) per station at 657 United States NOAA GHCNd stations (area weighted) with at least 100 years of daily data and 90% daily completeness from 1895 to 2025.
The long-term trend is down. ⬇️
𝐓𝐨𝐩 𝟏𝟎 𝐲𝐞𝐚𝐫𝐬 𝐰/ 𝐦𝐨𝐬𝐭 𝐝𝐚𝐲𝐬 𝐓𝐦𝐚𝐱 ≥𝟗𝟓°𝐅:
1️⃣ 1936
2️⃣ 1934
3️⃣ 1954
4️⃣ 1931
5️⃣ 1933
6️⃣ 1913
7️⃣ 1925
8️⃣ 1980 (most recent)
9️⃣ 1930
🔟 1911
Interestingly, only one of top 15 has been in the last 70 years, and only two in the 21st century made the top 20 (2011 and 2012, which rank 17th and 19th place, respectively).
𝐓𝐨𝐩 𝟏𝟎 𝐲𝐞𝐚𝐫𝐬 𝐰/ 𝐦𝐨𝐬𝐭 𝐝𝐚𝐲𝐬 𝐓𝐦𝐚𝐱 ≥𝟏𝟎𝟎°𝐅:
1️⃣ 1936
2️⃣ 1934
3️⃣ 1954
4️⃣ 1930
5️⃣ 1901
6️⃣ 1913
7️⃣ 1980 (most recent)
8️⃣ 1931
9️⃣ 1925
🔟 1918
𝐓𝐨𝐩 𝟏𝟎 𝐲𝐞𝐚𝐫𝐬 𝐰/ 𝐦𝐨𝐬𝐭 𝐝𝐚𝐲𝐬 𝐓𝐦𝐚𝐱 ≥𝟏𝟎𝟓°𝐅:
1️⃣ 1936
2️⃣ 1934
3️⃣ 1954
4️⃣ 1930
5️⃣ 1901
6️⃣ 1980
7️⃣ 1913
8️⃣ 2023 (most recent)
9️⃣ 1918
🔟 1933
The heatwave in Texas and Oklahoma in 2023 bumped it up to 8th place.
But a more robust metric to assess time-dependent changes in extreme heat events would be to look at the area-weighted average number of heatwaves per station per year.
The chart on the right shows that.
Heatwaves are defined here as a ≥3 consecutive day period where the daily maximum temperature is ≥90th percentile (against 1991-2020 averages) for that date for that station and for the months May-September.
Once again, the trend is down. ⬇️
𝐓𝐨𝐩 𝟏𝟎 𝐲𝐞𝐚𝐫𝐬 𝐰/ 𝐦𝐨𝐬𝐭 𝐡𝐞𝐚𝐭𝐰𝐚𝐯𝐞𝐬:
1️⃣ 1936: 5.77
2️⃣ 1934: 5.39
3️⃣ 1933: 5.15
4️⃣ 1931: 4.90
5️⃣ 1911: 4.85
6️⃣ 1954: 4.71
7️⃣ 1925: 4.59
8️⃣ 1930: 4.41
9️⃣ 1913: 4.35
🔟 1952 / 1939: 4.34
None of the top 20 have been in the 21st century. The most recent summer with the greatest number of heatwaves per U.S. station occurred in 1988. All other 19 occurred 70+ years ago. It is also worth mentioning that whether or not you consider the 1930s to be an outlier, 2012 is the most recent entry at #30.
Most of the warming that we measure is in overnight low temperatures, not daytime highs, and a significant amount of that could be due to urbanization.
So, if it reaches 100°F at your house next week, it’s just summer.
Carry on! 🏖️ 🌴
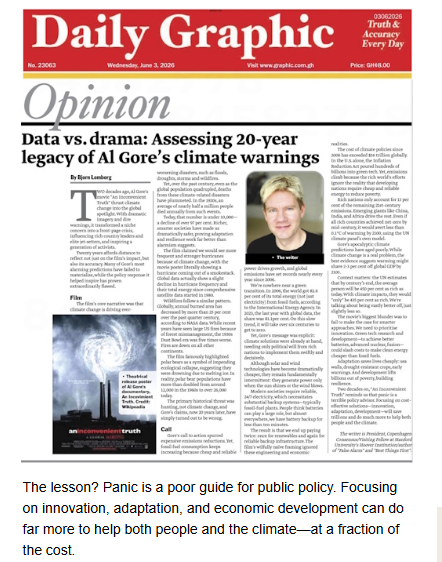
The depressing 20-year legacy of An Inconvenient Truth
20 years ago, An Inconvenient Truth put climate change at the center of global debate, shaping politics, influencing leaders, and inspiring a generation of activists.
Two decades later, we can assess not just its impact, but its accuracy. Many of the film’s most alarming predictions did not materialize, while many of the policies it inspired have proven costly and ineffective.
From my latest newsletter: https://t.co/ijK1hTSIc0
Sign up: https://t.co/PIif2dDeWJ
The alarmists have been pushing bogus attribution analysis to fear monger climate change. France only has data back to 1947, while US data goes back to 1890 and the data show heat waves were worse in the 1930s when CO2 had little effect.
Read: Extreme Heat Waves Not Related to Greenhouse Warming.
https://t.co/jeu8aPw4Fi
&
Read:The omega block over France intensifies heat wave by increasing pressure system duration. Clockwise air circulation draws hot Sahara air into Europe.
https://t.co/P4XXdtrsH8
Only "some"? "As Europe Sweats, Some Politicians Talk of Air-Conditioning, Not Climate Action."
Fossil fuels have taken the world from less than billion to more than 8 billion living wealthier, healthier and freer lives than ever before. There is no evidence that fossil fuels have anything to do with hot weather. Air conditioning is one of those fossil fuel-based technologies that improve your standard of living, yet on ly "some" European politicians support it.🙄
BTW, there would be many fewer heat wave-related deaths if Europeans would simply learn to swim. No emissions cuts needed.
https://t.co/TLeP7SGhfY
This is the saddest chart you’ll ever see.
The rise and sudden fall of nuclear power in Germany 🇩🇪 vs. China's 🇨🇳 boom.
I think about it all the time.
Don’t be like Germany.
This is the most illiberal government in Britain since king John ran the place. Or maybe Henry VIII.
They wake up in the morning thinking what can we ban today. Or tax. Or mandate.
Reminder: Attributing weather events to "climate change" is fraud. It's why World Weather Attribution @WWAttribution blocks vs. debates me.
https://t.co/T2Ssu1hprF