Earn a dollar more, take home less. Benefit cliffs happen when a household loses more in benefits than it gains in earnings.
CliffWatch shows where, when, and how — across earnings levels and US states.
Live demo Fri May 29, 1pm ET → https://t.co/8CgyC0np8T
New @UHEROnews analysis uses PolicyEngine to simulate Hawaii's childcare credit bills — first the direct household effect of the expanded CDCC, then the integrated CDCC, EITC, SNAP, WIC, and state income tax impact when a second earner enters the workforce in response.
Today at 11 AM at EAGxDC: why frontier LLMs miss basic tax and benefit math, what changes when AI agents call an open simulator, and where our new initiatives like PolicyBench and the Economic Parameter Atlas come in.
We added a ton of ingredients to @ThePolicyEngine cauldron last month:
- 1,039 PRs merged (7× April 2025, 2× March 2026)
- 341,318 source-code lines changed
- 19 new repos
Childcare subsidy rules, Forbes 400, better reproducibility - all make our models more accurate & useful.
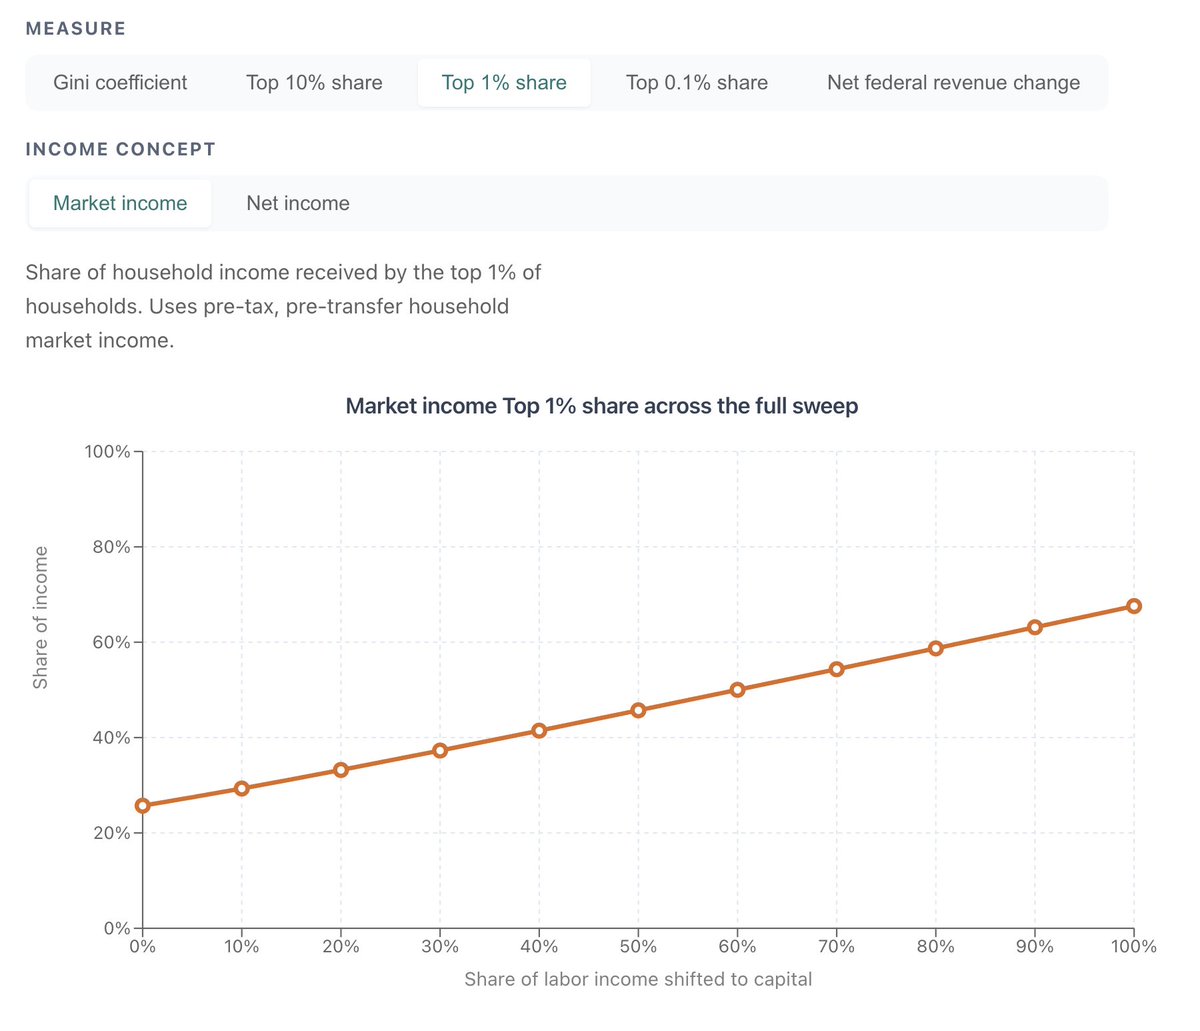
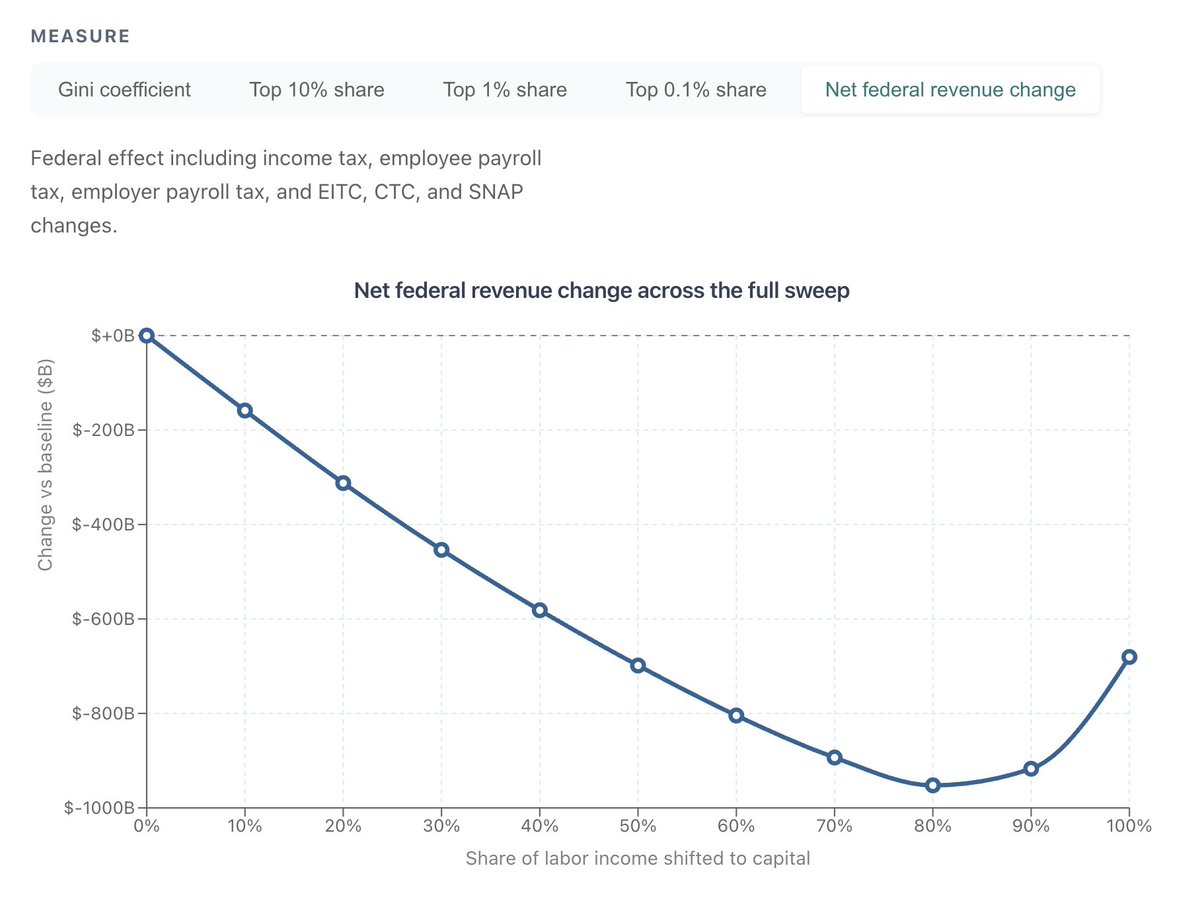
The first analysis from our AI and economics research initiative answers the question: What happens if income shifts from labor to capital?
We find a 10% shift raises the top 1%'s market income share from 25.7% to 29.3%. After taxes and transfers: 21.4% to 24.4%. Policy absorbs about 19% of the increase.
https://t.co/dABkHeROm1
NEW INTERACTIVE: @repkmr has released the Working Parents Tax Relief Act (WPTRA), which increases the maximum EITC benefit by $5,500 for each child under 4 in a tax unit.
We project the bill would:
- Lower federal revenues by $184.1B over 10 years
- Benefit 2.9% of households and reduce child poverty by 1.4% in 2026
How much would California's billionaire wealth tax actually raise? It depends on your assumptions about avoidance, departures, and income tax loss.
We built an interactive calculator that lets you explore the tradeoffs — with presets calibrated to existing papers.
@MaxGhenis and @ThePolicyEngine team have integrated frontier agentic AI into the most expansive open source microsimulation model of US fiscal policy. AI allows easier use and access as well as automates much of the model creation and maintenance.
https://t.co/QCnXtVEMsz
The @JECRepublicans just released an Immigration Fiscal Impact Calculator powered by PolicyEngine's tax and SNAP calculations.
Try it here: https://t.co/kmXYtgmaYt
We updated the State Legislative Tracker: You can now track tax bills across all 50 states, see each bill's legislative stage, follow real-time activity, and jump to full PolicyEngine analysis.
Try it at https://t.co/OiirlYctQ8
With our new calculator for the Temporary Assistance for Needy Families (TANF) cash assistance program, you can estimate TANF eligibility and benefit amounts for any household across all 50 states and DC.
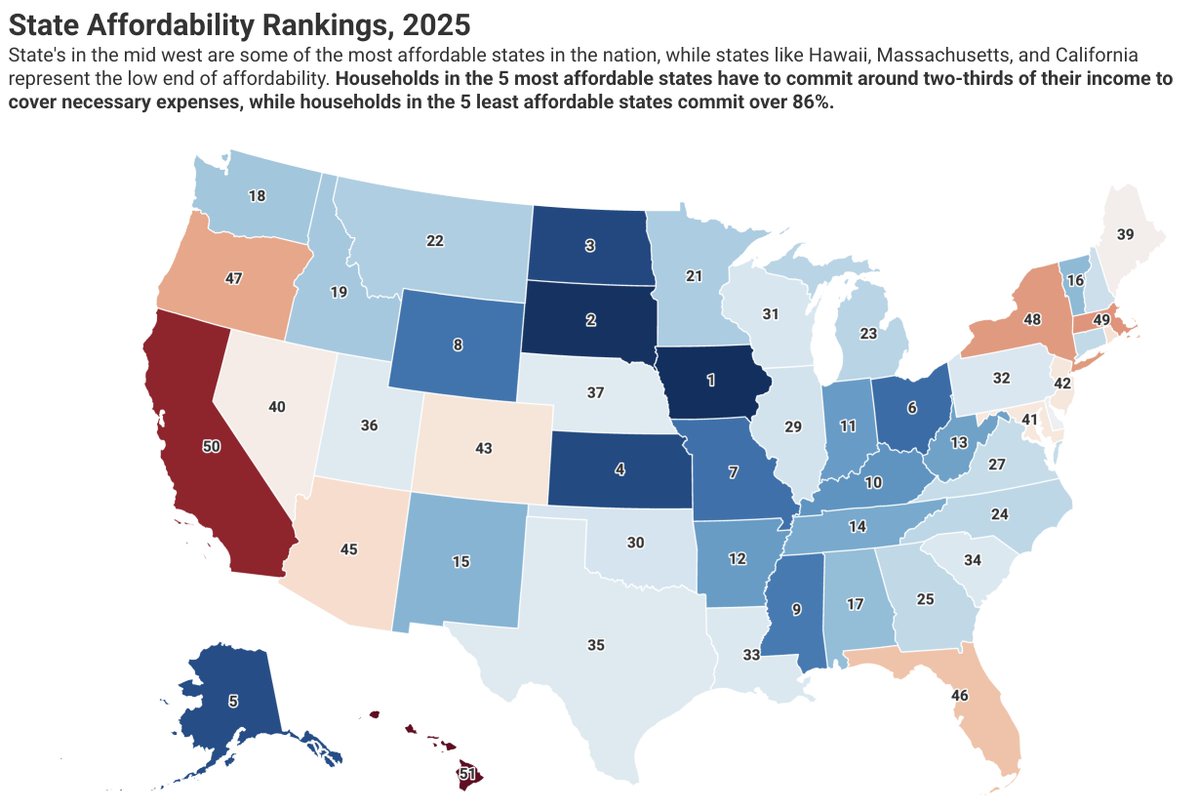
The Common Sense Institute @CSInstituteOR's new affordability report calculates state and federal income tax using PolicyEngine as part of its cross-state analysis of household costs.
https://t.co/nBZPPTiKyP
PolicyEngine received an honourable mention in @impact_innovEN's G7 GovAI Grand Challenge. We’re encouraged to see open-source infrastructure for tax and benefit analysis recognized as a promising public-sector AI application. https://t.co/cybRB3Slvh
NEW INTERACTIVE: PolicyEngine has built a calculator analyzing Senator @ChrisVanHollen's Working Americans' Tax Cut Act.
https://t.co/OYRauajF7o
Here's what's in it 🧵
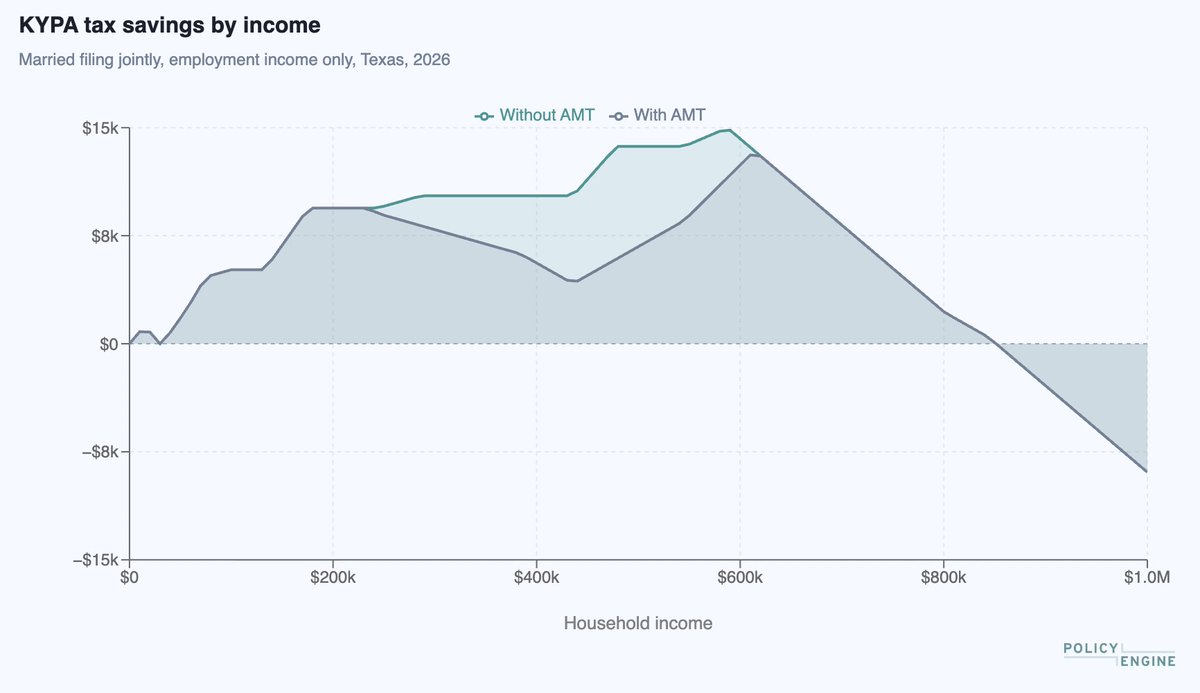
New analysis: The Alternative Minimum Tax claws back up to 59% of @SenBooker's Keep Your Pay Act tax benefits.
Read it: https://t.co/U3AmHUGGQT
While Senator Booker's calculator does not capture the AMT interaction, ours does. Try it here: https://t.co/IUAV5jznCe
In a new Break Glass report, @BudgetHawks cites PolicyEngine modeling as part of its surtax analysis. We estimate that a 1% surtax on AGI between $100K and $1M, plus a 2% surtax above $1M, would raise about $900 billion over a decade.
https://t.co/olHi60cs8K
NEW ANALYSIS: @SenBooker's Keep Your Pay Act - higher standard deduction, expanded CTC & EITC, higher top tax rates.
Static model finds:
- $5.2T 10-year cost
- 73% of households gain, 1.6% lose in 2026
- Poverty falls 10% in 2026
We also provide a personalized calculator.