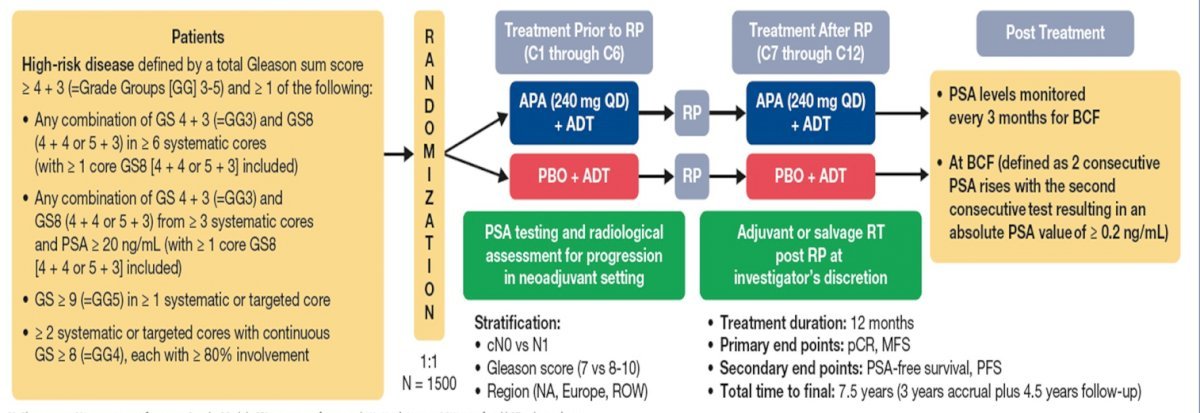
IMHO, the sole advantage of surgery for these high risk pts would be the possibility of avoiding long-term ADT. With perioperative ADT, not only is this advantage lost, but we also forfeit critical data, such as accurate surgical staging and postoperative PSA🤷🏻♂️
2/n #ASCO26
The design.
Peri-operative ADT (12m) + RP vs
Peri-operative ADT+Apa (12m) + RP
Robustly blinded, placebo controlled.
Some may criticize that the SOC is not RP+ADT, but simply RP, but others may state this raises the bar to show benefit of apalutamide.
@WallisCJD@HimanshuNagarMD@ChapinMD@CaPsurvivorship@wandering_gu
Bladder-preserving IO-CRT strategy shows encouraging early results in RAD-IO presented by #NicholasJames: durvalumab + chemoradiotherapy achieved 1yDFS 79%, 12-mo PFS 83%, and OS 96% with manageable toxicity in MIBC.
#ASCO26#BladderCancer@OncoAlert@ASCO@OncBrothers
🦴⚡️ In high-risk extremity soft tissue sarcoma, HDR intraoperative RT (IORT) boost achieved strong long-term local control with low severe toxicity and 100% limb preservation.
📊 5-year outcomes:
✅ Local control: 80%
✅ OS: 58%
✅ PFS: 52%
This cohort included many patients with adverse features:
⚠️ close margins
⚠️ prior unplanned (“whoops”) resections
⚠️ large/high-grade tumors
🎯 IORT may help modern sarcoma care by:
🔹 precisely escalating dose to highest-risk regions
🔹 minimizing normal tissue exposure
🔹 reducing geographic miss of the tumor bed
🔹 potentially improving control where standard EBRT boost data remain mixed
As extremity STS management becomes increasingly personalized, HDR-IORT may play a bigger role in the treatment paradigm!
Does your institution do IORT for extremity STS?
@ASTRO_org
https://t.co/EOhjgJrcb5
Un equipo investigador navarro encuentra un sistema para predecir mejor la necrosis cerebral por radioterapia
@salud_na
▶️ Info: https://t.co/qypZD2ptZv
📢 Presentado en #ESTRO26 análisis intermedio del ensayo fase III START-MET sobre SBRT + tratamiento estándar en cáncer de CPHS oligometastásico
🔎 De los primeros 230 pacientes incluidos, solo un 3% presentó toxicidad grado ≥2 relacionada con SBRT
@Antoniojconde
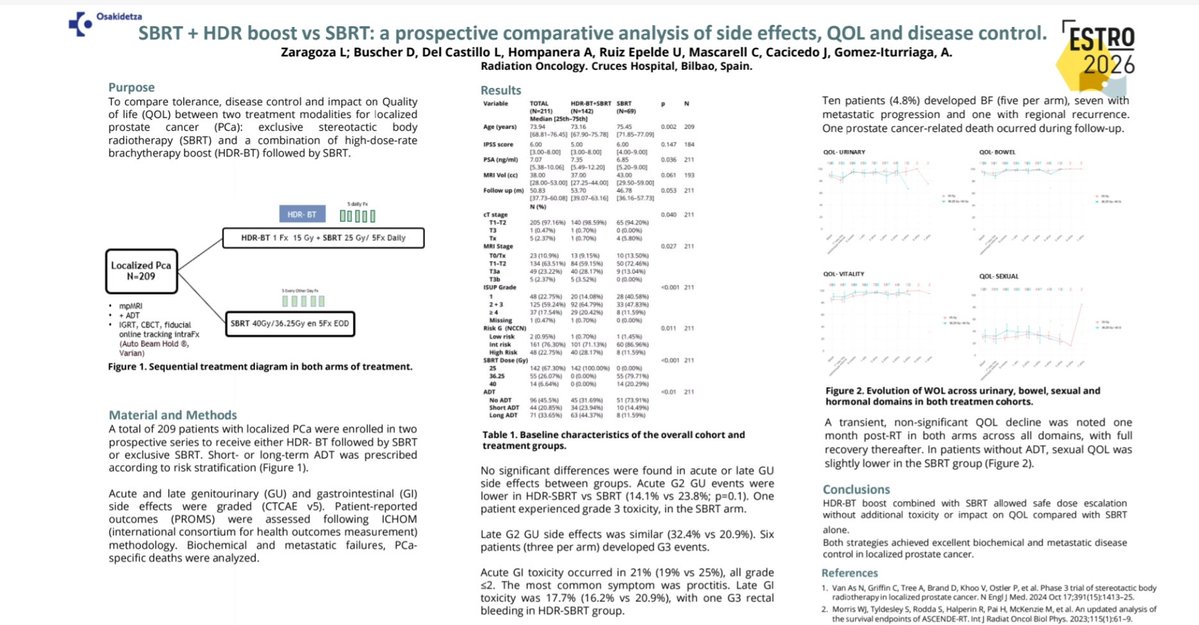
¡Otro gran trabajo en #ESTRO2026! Compartimos los resultados a largo plazo de la braquiterapia HDR boost en cáncer de próstata (TC based vs TRUS). Datos robustos con más de 10 años de seguimiento medio que avalan un excelente control y supervivencia de los pacientes.
Os informamos que el jueves 4 de junio en el congreso #SEOR2026 se celebrará la Jornada de Puertas Abiertas para pacientes y familias, concebida como un espacio cercano para el intercambio de experiencias, el diálogo y la visibilización del recorrido del paciente en Oncología Radioterápica.
Formulario de inscripción: https://t.co/7T1wr61Ual
¡Os esperamos!
#jornadapacientes #oncologíaRadioterápica #Radioterapia
¿Añadir boost de braquiterapia HDR a la SBRT en cáncer de próstata localizado? Compartimos nuestros datos en #ESTRO2026: ambas estrategias logran un control bioquímico excelente con perfiles de toxicidad y calidad de vida (QOL)
Great data today on prostate cancer @ESTRO_RT Isabel Syndikus presenting the adverse events of the PIVOTALboost trial prostate vs prostate and pelvis in 20 fractions- no long term differences in side effects @EmmaHall71
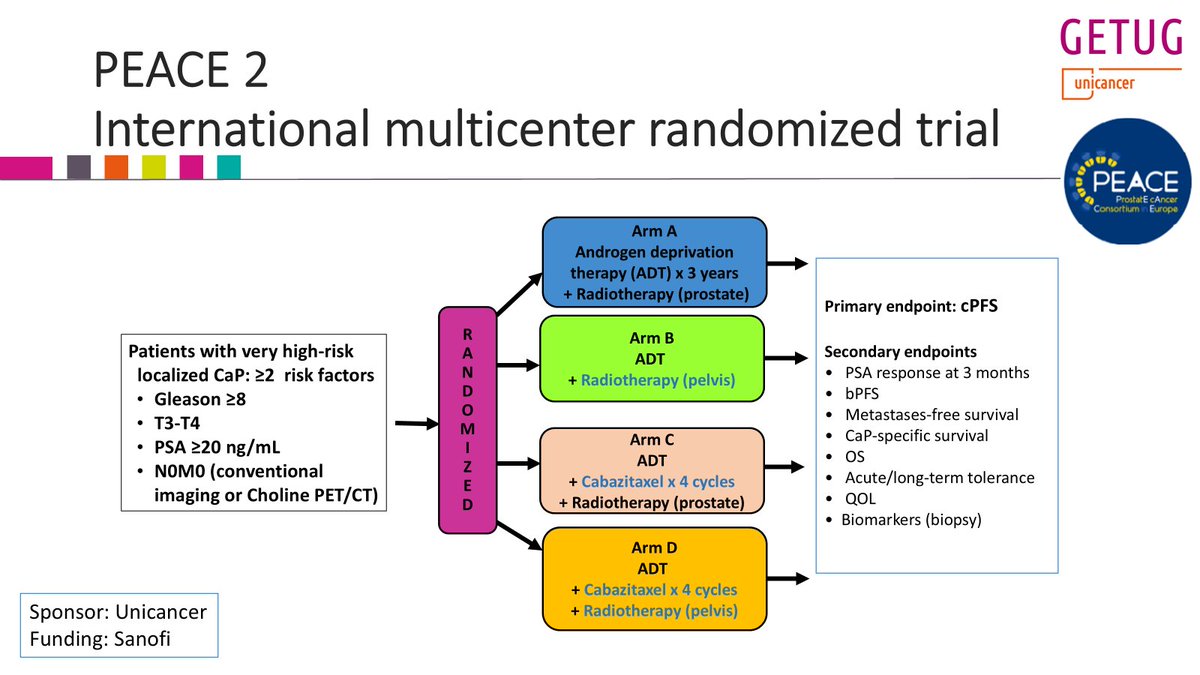
There are now 5 RCTs addressing the Q of ENI in high/very high risk prostate cancer (NRG 9413, 0924; GETUG-01; POP-RT and PEACE-2). Only POP-RT is positive (less than 4%) of total.
All show increase adverse events.
I think the data are clear. But debates will be inevitable
Yesterday, I presented the @GETUG_Unicancer PEACE 2 trial at #ESTRO26 on the role of pelvic RT in very high risk #prostatecancer pts (staged with conventional imaging).
Twittorial below
Key conclusion: pelvic RT did not improve clinical outcomes (cPFS, MFS, PCSS, OS)...
1/n
You'll recognize a few names on this author list!
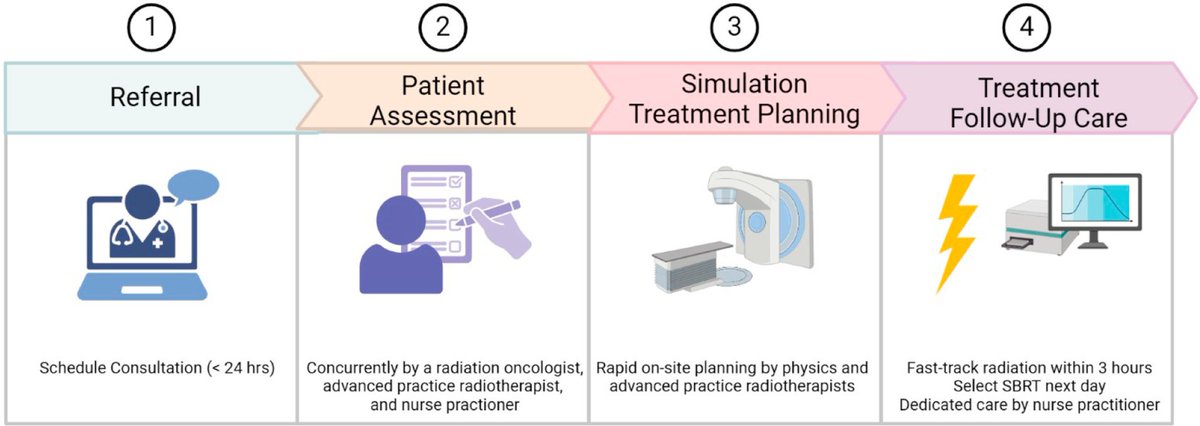
@AgrawalAmiya@CJTsaiMDPhD & team show us that palliative RT is undergoing a major evolution ⚡️—from symptom relief ➡️ a multidisciplinary, precision-driven discipline with a dedicated workflow!
What’s changing?
🧠 Team-based care is central: #radonc + physicists + advanced practice RTTs + NPs + supportive care = more personalized, efficient & safer treatment decisions
⏱️ Rapid-access clinics
✔️ Referrals seen within ~24 hrs
✔️ “One-stop” visits: consult + simulation same day
✔️ Fast-track pathways deliver RT within hours for pain crises
🚀 Workflow innovation
✔️ Simulation-free RT using recent diagnostic CTs
✔️ Single-fraction treatments (8–20 Gy)
✔️ Fewer hospital visits + faster symptom relief
🎯 Better technology = better care
✔️ IMRT/VMAT + SBRT improve conformality
✔️ Reduce toxicity to normal tissues
✔️ Enable safer re-irradiation & hypofractionation
👩⚕️ Advanced providers expand capacity
✔️ pAPRTs: contouring, planning, workflow leadership
✔️ NPs: toxicity management, follow-up, continuity
✔️ Earlier detection of complications + improved experience
🔬 Not just care—innovation hub
✔️ Trials reducing skeletal events with prophylactic RT
✔️ Survival gains (e.g., proton CSI in leptomeningeal disease)
🚨Bottom line:
Palliative RT is no longer just supportive care—it’s fast, adaptive, multidisciplinary, and increasingly impactful on outcomes and quality of life 💡
@ASTRO_org
https://t.co/NfWszIGdn4
📊 How much do governments spend, and what do they spend it on?
In the chart, we see total government spending broken down by purpose, such as health, education, and defense, relative to the size of the economy (as measured by GDP). This is shown for a selection of OECD countries.
How much governments spend varies quite a lot across OECD countries: in France it’s 57% of GDP, while in Chile it’s less than half that (28%).
Keep in mind that these are relative shares, not absolute amounts. GDP itself varies considerably across countries, so the same percentage can represent very different sums depending on the size of a country’s economy.
For some categories, such as social protection — which includes things like pensions, unemployment benefits, disability support, and other benefits — the difference across countries is relatively large. For example, it’s 26% in Finland compared to 7.9% in the US.
In other categories, such as public services — which include things like paying interest on government debt, the running of core government functions, and foreign aid — the share is more similar across countries.
This data comes from the OECD’s Government at a Glance dataset, which covers 47 countries. Our colleague @parriagadap recently updated our charts with the latest release.