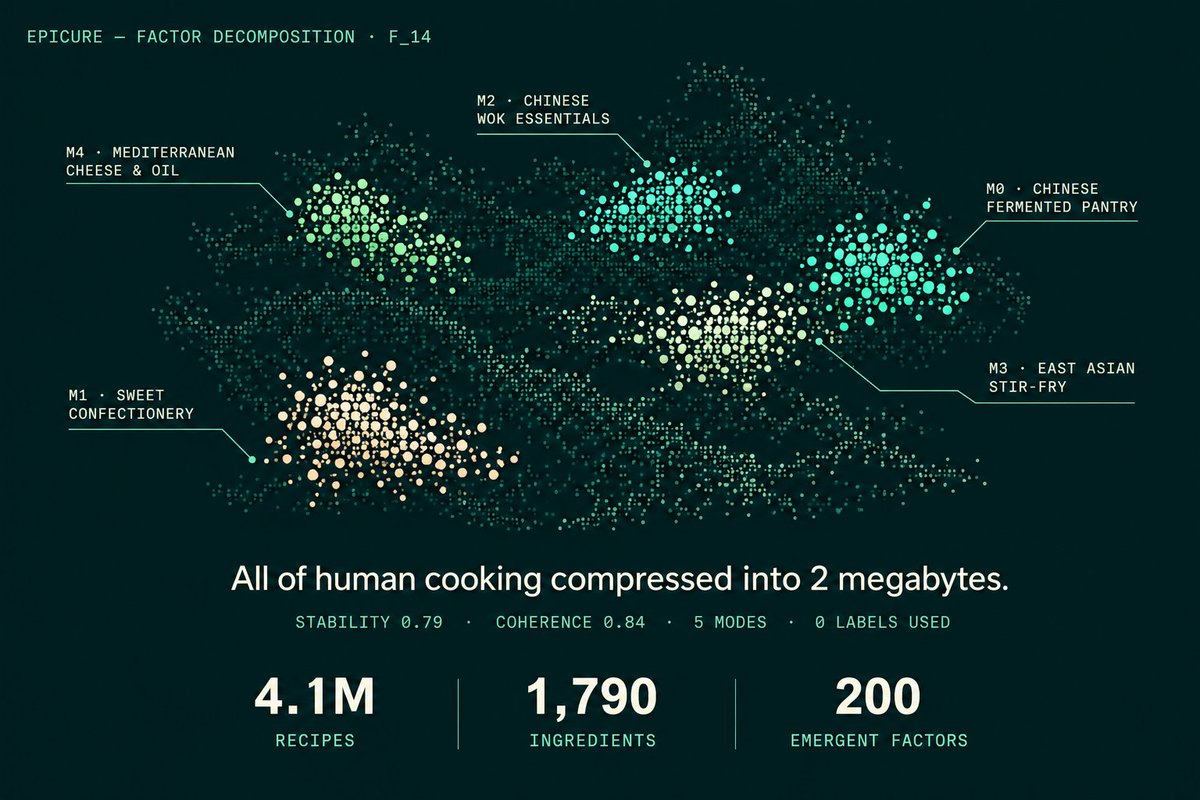
Launching our new paper on arXiv: we trained the largest multilingual food model ever built.
4.1M recipes. 7 languages. 1,790 ingredients. 300 dimensions.
All of human cooking compressed into 2 megabytes.
🔥DeepSeek Input Cache Price Drop!
Effective immediately, the price for input cache hits across the ENTIRE DeepSeek API series is reduced to just 1/10th of the original price! Build more efficiently for less.
📌Reminder: The DeepSeek-V4-Pro 75% OFF promotion is still active until May 5th, 2026, 15:59 (UTC Time).
Every memory system for LLM agents evolves what it stores. None evolves how it retrieves.
🧬 EvolveMem is out, now shipping inside the SimpleMem v0.3.0 update. Powered by AutoResearch: the system researches its own retrieval, treating the full retrieval config as a structured action space and running a closed loop: evaluate ➜ diagnose ➜ propose ➜ validate ➜ repeat.
🔬 From a minimal baseline, 7 autonomous rounds produce a retrieval policy that beats the strongest published baseline by +25.7% on LoCoMo and +18.9% on MemBench.
🧬 It discovers entirely new retrieval dimensions not present in the original design, all integrated into the unified SimpleMem package.
📄 Paper: https://t.co/BWCXebWhG1
💻 Code: https://t.co/hhdgvVjblP
Led by @itsJiaqiLiu, @XinyeYee with contributions from @richardxp888, @ZhengBerkeley, @cihangxie
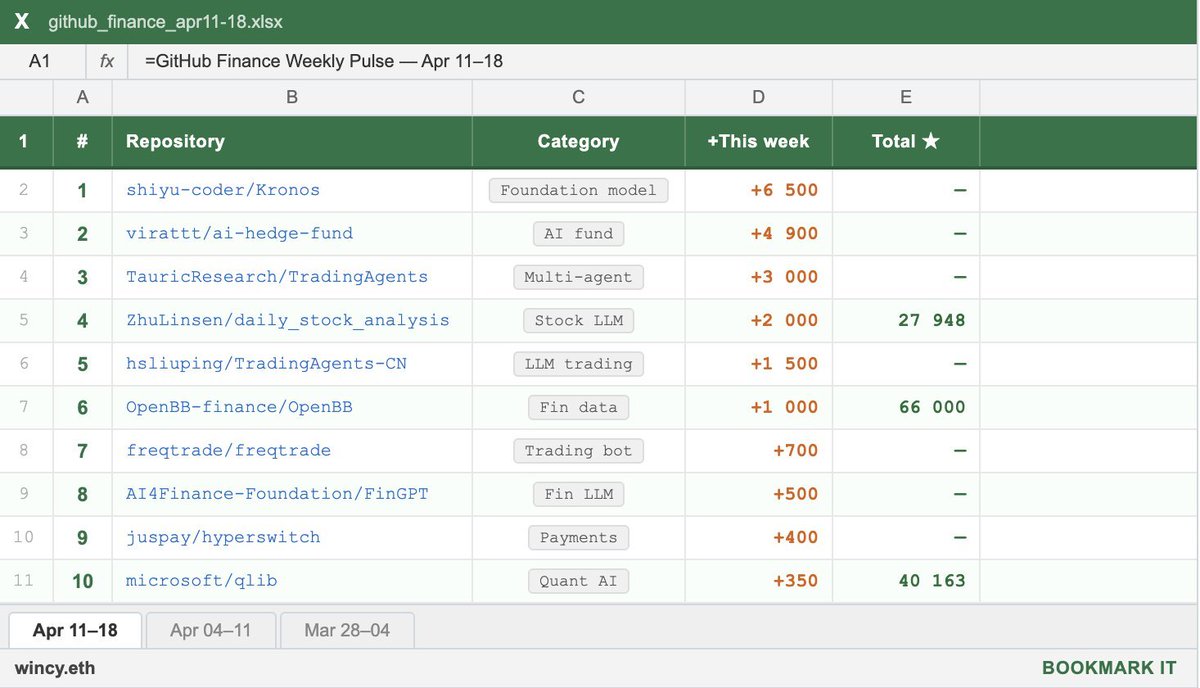
Bloomberg paid Man Group to license this database. It's been sitting on GitHub for free the whole time.
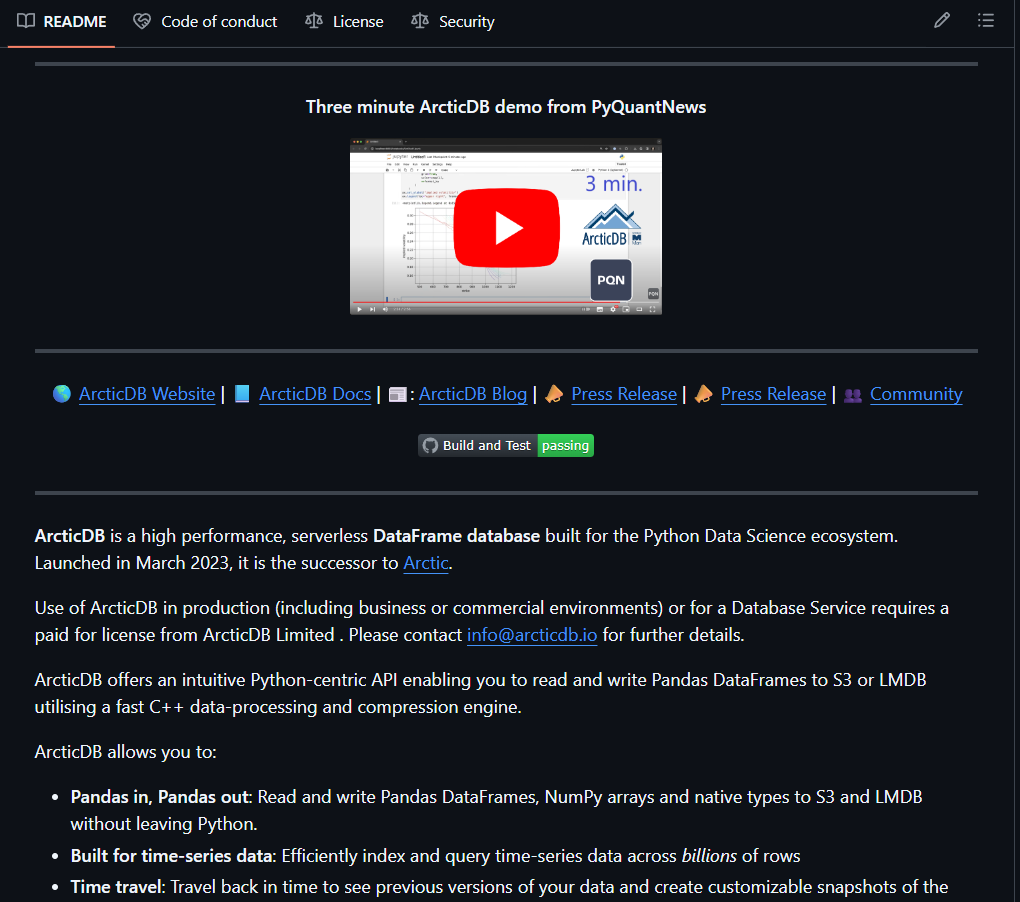
Man Group manages $228B in assets. Their engineers built ArcticDB to store and query billions of rows of time-series data - the kind of data that powers quantitative trading at scale.
Bloomberg thought it was valuable enough to pay for. You can pip install it right now.
> What it actually does:
Pandas in, Pandas out. Write a DataFrame to S3 or local disk, read it back instantly. No server. No infrastructure. No DevOps.
20 years of data on 400,000+ securities in a single symbol. It handles what CSV files and regular databases collapse under.
Time travel built in. Roll back to any previous version of your data. If yesterday's backtest used different data than today's - you can see exactly what changed.
Schemaless. Append, update, modify without touching a schema definition. For anyone who's spent hours migrating database schemas - this matters.
The C++ engine handles compression and concurrency under the hood. You never leave Python.
For quant research, backtesting, Polymarket data analysis, or any project where you're storing time-series at scale - this is the tool hedge funds actually use internally.
Versions up to 4.2 already converted to Apache 2.0. Fully free, no restrictions.
https://t.co/tKKaMCJvMJ
This works really well btw, at the end of your query ask your LLM to "structure your response as HTML", then view the generated file in your browser. I've also had some success asking the LLM to present its output as slideshows, etc.
More generally, imo audio is the human-preferred input to AIs but vision (images/animations/video) is the preferred output from them. Around a ~third of our brains are a massively parallel processor dedicated to vision, it is the 10-lane superhighway of information into brain. As AI improves, I think we'll see a progression that takes advantage:
1) raw text (hard/effortful to read)
2) markdown (bold, italic, headings, tables, a bit easier on the eyes) <-- current default
3) HTML (still procedural with underlying code, but a lot more flexibility on the graphics, layout, even interactivity) <-- early but forming new good default
...4,5,6,...
n) interactive neural videos/simulations
Imo the extrapolation (though the technology doesn't exist just yet) ends in some kind of interactive videos generated directly by a diffusion neural net. Many open questions as to how exact/procedural "Software 1.0" artifacts (e.g. interactive simulations) may be woven together with neural artifacts (diffusion grids), but generally something in the direction of the recently viral https://t.co/z21CP5iQfu
There are also improvements necessary and pending at the input. Audio nor text nor video alone are not enough, e.g. I feel a need to point/gesture to things on the screen, similar to all the things you would do with a person physically next to you and your computer screen.
TLDR The input/output mind meld between humans and AIs is ongoing and there is a lot of work to do and significant progress to be made, way before jumping all the way into neuralink-esque BCIs and all that. For what's worth exploring at the current stage, hot tip try ask for HTML.
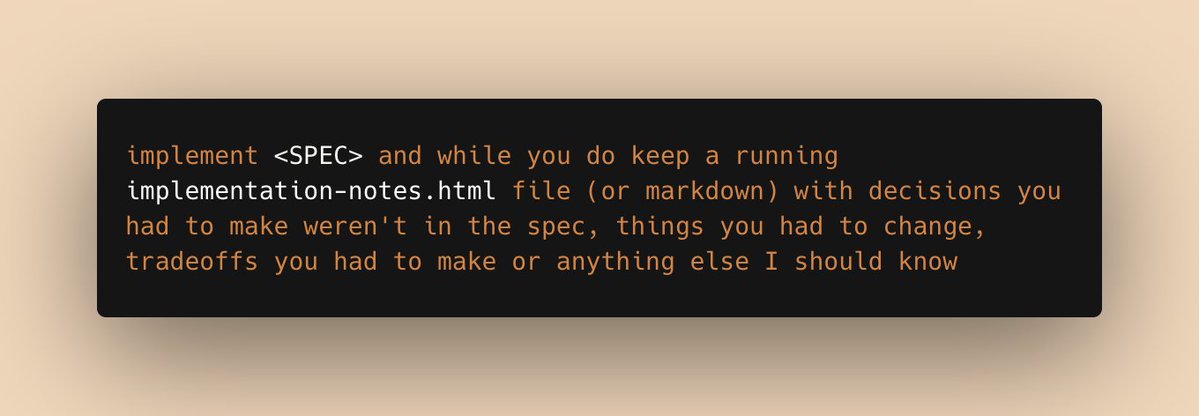
a prompt I've been using a lot recently:
implement <SPEC> and while you do, keep a running implementation-notes.html file (or markdown) with decisions you had to make weren't in the spec, things you had to change, tradeoffs you had to make or anything else I should know
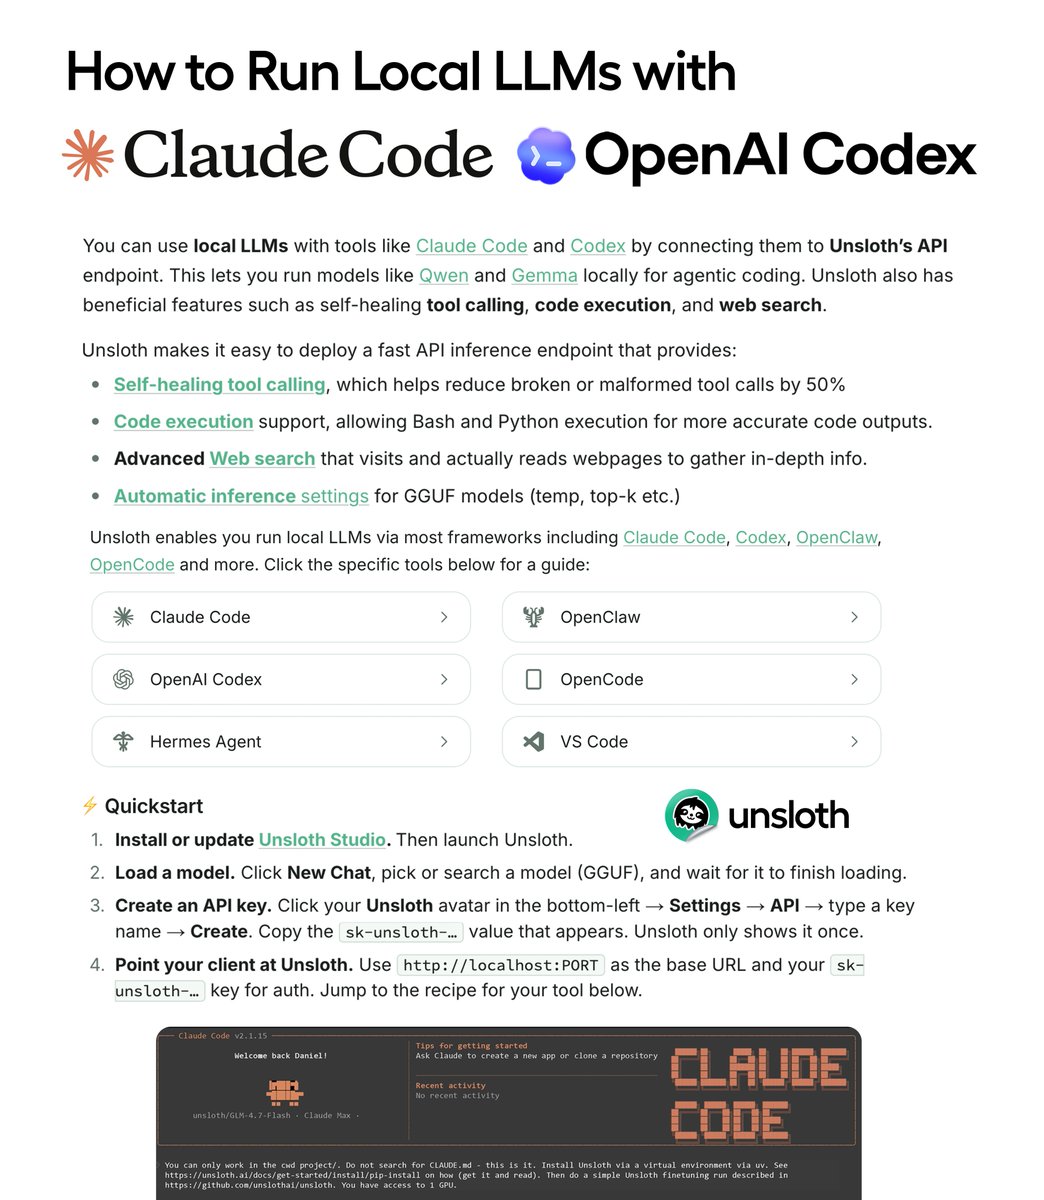
We made a guide on how to run open LLMs in Claude Code, Codex and OpenClaw.
Use Gemma 4 and Qwen3.6 GGUFs for local agentic coding on 24GB RAM
Run with self-healing tool calls, code execution, web search via the Unsloth API endpoint and llama.cpp
Guide: https://t.co/VienFDSwcg
@Alibaba_Qwen Qwen3.6-27B MLX quants for macOS are available here: https://t.co/nXa4zTxsom
The rest of the Qwen3.6-27B GGUFs are now uploaded as well, including BF16 and Q8. 🙏
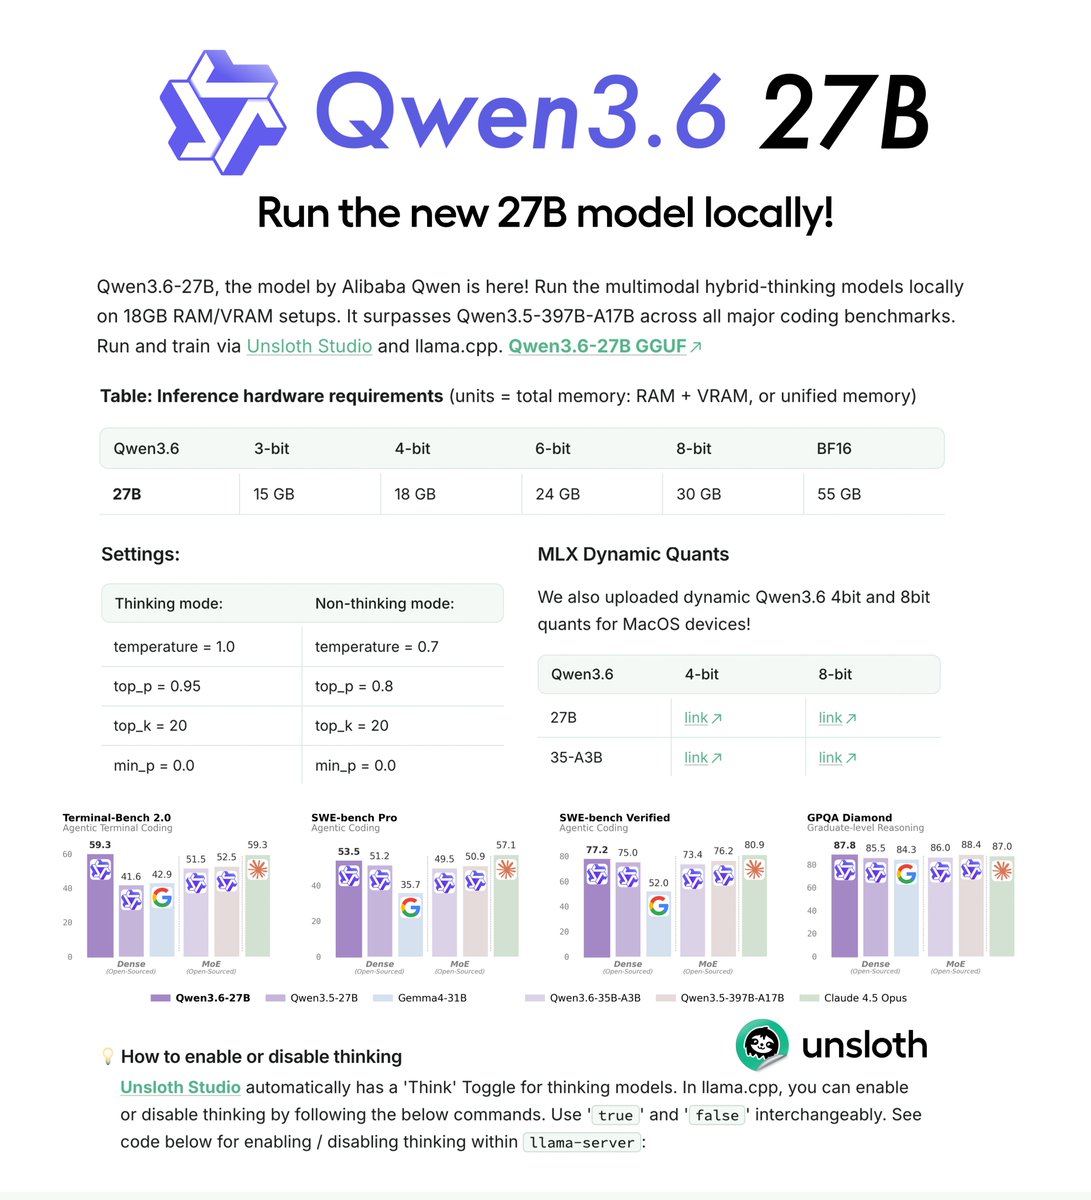
Qwen3.6-27B can now run locally! 💜
Run on 18GB RAM via Unsloth Dynamic GGUFs.
Qwen3.6-27B surpasses Qwen3.5-397B-A17B on all major coding benchmarks.
GGUFs: https://t.co/ykKgwh2zI9
Guide: https://t.co/ITLNq20WJp
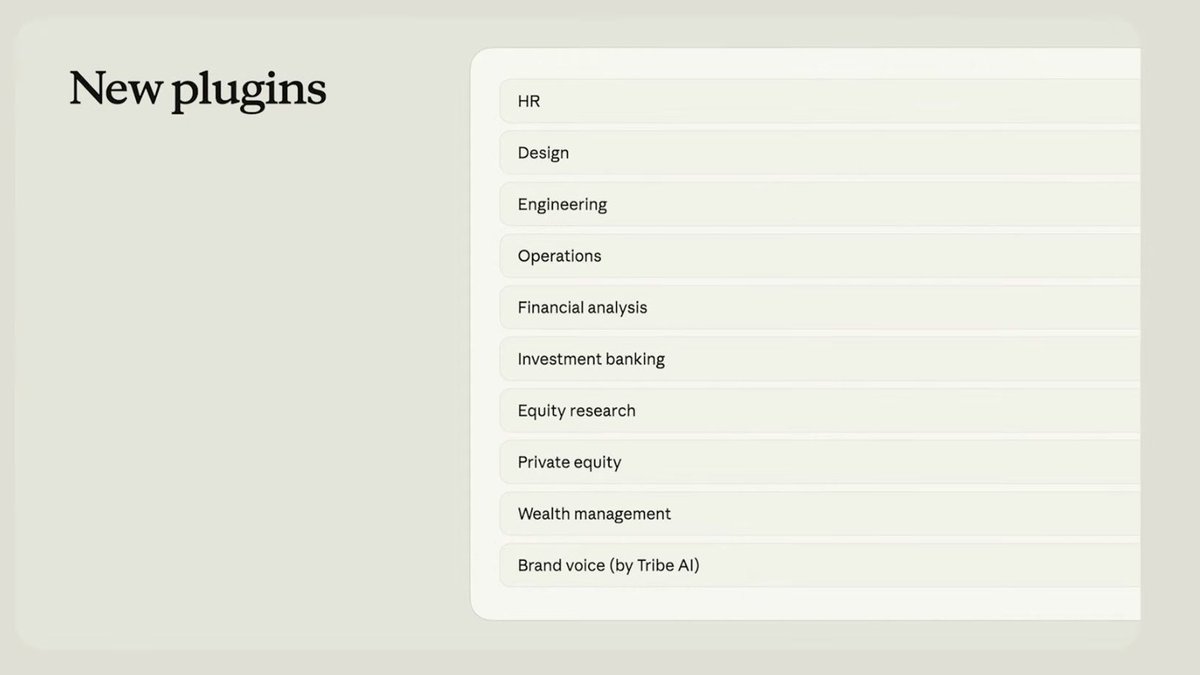
We use skills to maintain our Agents SDK repositories through repeatable workflows for verification, integration tests, release checks, and PR handoff.
Here’s how it works:
https://t.co/DyuEj35D1H
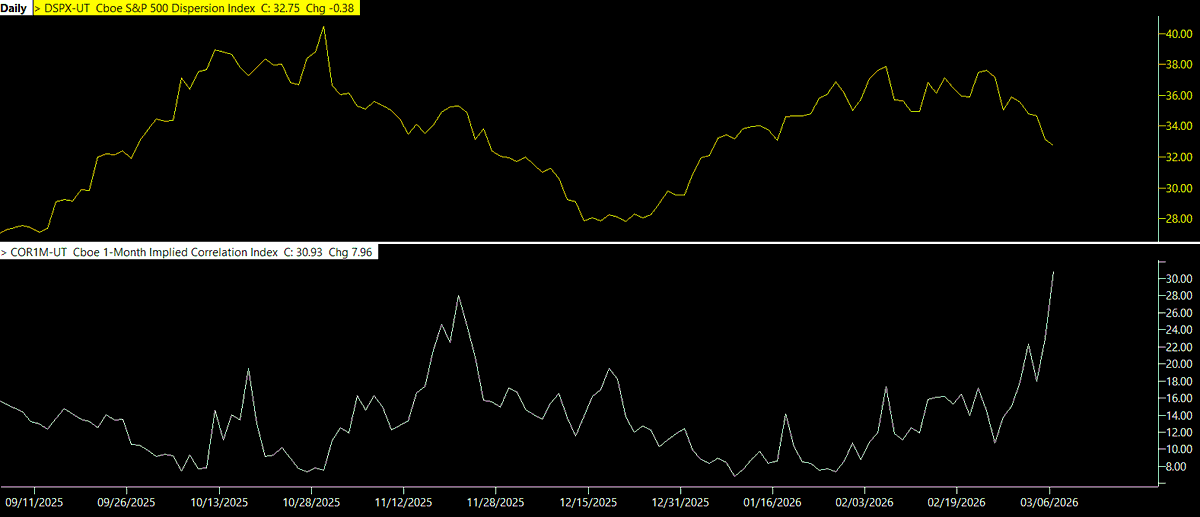
Gamma is losing its grip:
Implied dispersion (DSPX) is falling while implied correlation (COR1M) is rising. That combination is a critical warning signal for the stability of the "gamma grip" regime that has pinned the S&P 500 for months.
When DSPX falls, the options market is signaling that individual stocks are expected to move less independently. Their idiosyncratic variance is compressing. At the same time, rising COR1M means the market expects the components of the index to move more in unison. The stabilizing effects of dealer call‑vanna and gamma hedging are weakening. The “calm index / moving constituents” dynamic that had previously allowed dispersion hedges and single‑name volatility trades to absorb shocks is disappearing. Without that diversification across components, the S&P becomes one large monolithic trade rather than a basket of offsetting moves.
As dispersion collapses and correlation rises, dealers lose the ability to hedge vanna exposure through single‑stock vs. index dispersion trades. Under high dispersion, dealers could be long single‑name volatility and short index volatility, allowing idiosyncratic moves to cushion shocks in the index. But when DSPX contracts, the relative movement in single names dries up, meaning their hedges now concentrate risk instead of diversifying it. The index becomes far more sensitive to systemic flows, and the effectiveness of the “buy dips, sell rips” gamma grip shrinks. Dealer hedging shifts from being spread across many constituents to being overwhelmingly concentrated in index delta, magnifying the impact of small S&P moves.
Instead of dampening intraday volatility, gamma hedging becomes more fragile and more easily overwhelmed by headline shocks and flows. When the index moves, everything moves with it. The hedges that once suppressed movement now move into pro‑cyclical behavior: dealers are forced to chase deltas in the same direction as the move. On selloffs, vanna goes negative and dealers must sell into falling markets, accelerating the decline. The system behaves like a feedback loop.
The surge in VIX/VIXEQ toward the top of its multi‑year range shows that index‑level implied volatility (VIX) is now rising noticeably faster than S&P500 constituent‑level volatility (VIXEQ). That shift tells us the market is assigning more risk to the basket than to the underlying stocks, which is exactly what happens when dispersion collapses and correlations tighten. As this ratio rises, the idiosyncratic cushion dealers previously used to hedge vanna exposure erodes, and hedging becomes increasingly index‑centric. The result is an S&P 500 that behaves like a single correlated instrument: small moves require larger SPX‑delta adjustments, stabilizing gamma flows weaken, and the entire “buy‑dips, sell‑rips” mechanism loses traction. In this state, index vol leads, single‑name vol lags, and the loss of cross‑sectional noise leaves the system vulnerable to nonlinear amplification.
The rise in VIX/VOLI delivers the same message from a different angle: stress is migrating from the ETF hedging layer into the index‑vol complex. VOLI reflects SPY options like 0DTE, weeklies, and other short‑tenor contracts that normally provide cheap, precise intraday gamma. When SPX volatility (VIX) starts outpacing SPY volatility (VOLI), it signals that ETF‑based micro‑hedging is no longer absorbing shocks as effectively and that hedging pressure is shifting into the broader, less elastic SPX book. As this ratio climbs, SPX options begin to carry more of the hedging load, implying that 0DTE/ETF gamma is no longer enough to keep the index in line. The stabilizing local gamma supplied by ETFs wanes, and SPX hedges begin to dominate price formation. That shift makes the tape more sensitive to directional flows and reduces the system’s ability to contain volatility, especially when combined with falling dispersion and rising correlation.
The sharp rise in COR1M/COR3M signals that near‑term implied correlation is breaking higher much faster than medium‑term correlation, a sign that the market expects an imminent correlation snap rather than a slow‑building one.
This all aligns with the correlation‑event setup I described Feb 15. Then, the market exhibited fractured and contradictory internals: HLLI flagged simultaneous new highs and new lows, dispersion reflected extreme disagreement beneath a calm index, and LPPL pointed to late‑cycle extreme moves across sectors. All three measures indicated a market stretched across opposing pressures that almost always resolve through a sharp re‑correlation event. This resolution appears to be underway.
Taken together, the drop in DSPX, the surge in near‑term correlation (COR1M), the widening gap between COR1M and COR3M, and the pressure visible in VIX/VIXEQ and VIX/VOLI all point to a market structure that is on the verge of a correlation snap. The system is now vulnerable to a sudden, non‑linear release of the instability that has been quietly building under the pinned surface for months.
Wall Street is cooked.
I spent 100+ hours stress-testing the new Claude Opus 4.6 on live market data.
Most people are using it for basic summaries. They’re missing the point.
Here are 18 prompts that unlock institutional-level financial analysis (for free):
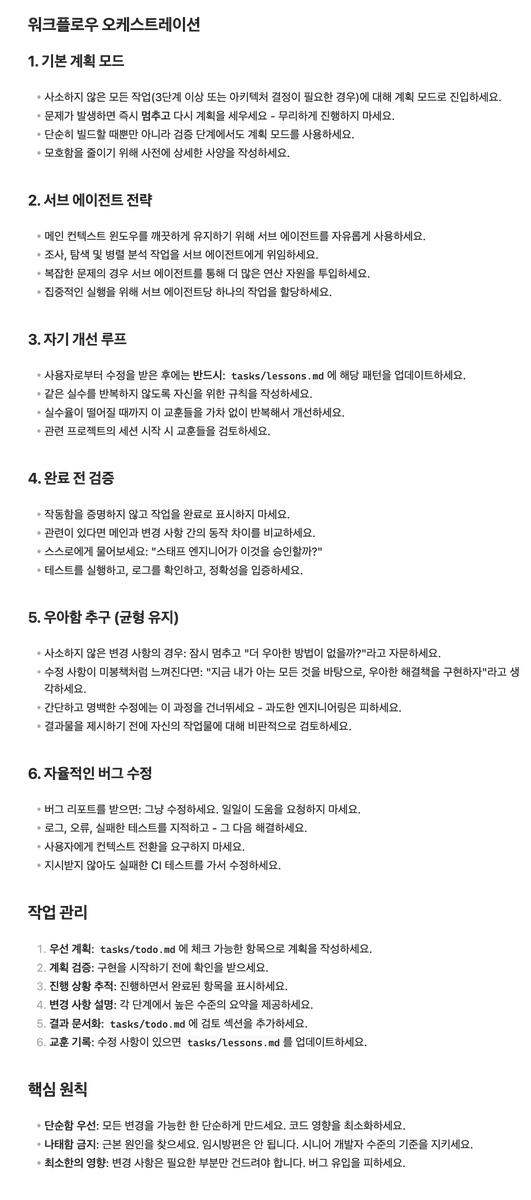
Claude Code를 만든 Boris Cherny가 팀 내부에서 실제로 사용하는 베스트 프랙티스와 워크플로우를 공개했는데,,
어떤 분이 스레드를 정리해서 https://t.co/KYRCeDDmmP 를 만들었군요.
참고 하시라고 한국어 버전 여기요.
https://t.co/kggTuObvg9
- 워크플로우 오케스트레이션
- 하위 에이전트 전략
- 자기계발 순환
- 완료 전 확인
- 자율적인 버그 수정
- 핵심 원칙
여기서 힌트를 얻을 수 있다면 좋겠죠. 자가 개선 루프..
중요하게 생각하는 부분은 피드백의 축적인데, 조금씩 규칙들을 개선해나가면 에이전트 만족도는 더 올라갑니다.
그게 꼭 Claude 만의 문제는 당연히 아니죠. 그렇게 Skill 또한 꾸준한 개선..