December 2024 I was 43 and had largely just accepted that part of getting older, running multiple businesses, traveling 45 weeks a year, and dealing with family, kids, and all the other stresses meant just accepting diminishing health.
It wasn’t just the 25+% body fat that you see in the photo on the left. It was skyrocketing cholesterol, triglycerides off the charts, brain fog, chronic stress, and the snoring. My poor wife.
As a former collegiate athlete, this body was the product of all of the above but I still worked out 3/4 times a week and was doing moderate cardio. But the sleep, supplementation, diet, and quality of exercise was far from optimal.
The day I took the photo on the left was the day I said it was time to change. Put my health and longevity into the priority bucket. Invest in me, so I can invest in my family, business, and live an optimal life chasing ambitions and experiences.
The journey has been humbling. Trying to reset your diet, refocus on training, manage sleep, and optimize supplementation was a lot to take on at once.
At the same time, the benefits. Beyond just looking better in the mirror. More confident, greater energy, more focus, better stress management, all made the journey feel more worthwhile.
And before you ask. It was all of the above. Working out hard 4/6 days a week. Eating more disciplined. Focusing on sleeping at least 6.5 hours a night all while traveling extensively.
And I discovered peptide therapy and optimal supplementation. This started with micro dosing a GLP-1, which helped reset my appetite. But I was steadfast not to look like an emaciated Ozempic user. So I focused on macros, protein intake, and leaned about peptide therapy. Adding the likes of Tesamorelin, Mots-C, BPC/TB, to support muscle retention while also adding peptides and supplements like NAD+, Glutathione, GHKCU, and Semax to help with cellular, immunity, and cognitive.
In the process I became convinced about the power of peptide therapy as a way to maximize the organic efforts of self-optimization and longevity. This led to me investing in and co-founding @Optimize_HP a national tele-health clinic that focuses on longevity and wellness offering a diverse set of peptides therapies and personalized protocols for people like me that want to optimize their health all under the care of licensed physicians.
This takes me to the photo on the right. Good lighting, but no filter. :)
Now 45 and in the best health of my life. Got my bloodwork done last week and for the first time in more than 15 years my cholesterol and triglycerides were normal. My cRP was optimal and everything else was where it should be. All coming after I was told I needed to be on a statin and BP meds just 18 months ago.
All of this to say it’s all achievable. The hard work is real and the discipline is more than most people are up for. But the results, beyond just the fun flexing photos in the gym are so worth it. Health is wealth they say. I couldn’t agree more. It’s all possible. Just have to want it.
(For more on the protocols and peptides I’m taking, I’ll update that periodically here. Not on TRT yet, but take enclomiphene for test support.)
Just updated our $TMDX flight tracker... 399 flights through 10.65 days which is 37.5 flights per day... up +11.8% MoM and +73.6% YoY
I have no idea if flights remain this strong through July or through Q3 but this is clearly not the typical seasonal slowdown we're used to seeing... last year July was the 2nd slowest month for flights... this year July is on a record pace... even if dry runs are up slightly there's obviously something more positive happening... excited for Q2 earnings and a business update from management on OCS trials, CHOPS, OCS Kidney and Europe expansion.
Management continues to say 10k OCS cases by 2028, 20k OCS cases by 2030 and 30k OCS cases by 2032.
Those targets don't include CHOPS which I think could add another 10-15% to case volumes although management hasn't given any guidance for CHOPS other than to say the original 2028/2030/2032 case targets do not include CHOPS.
If we add 10-15% to the 2030 number it gets us to 22.5k cases (midpoint)... which means $TMDX would need to grow OCS/CHOPS cases at a 34% CAGR from 2025 through 2030.
If $TMDX gets to 22.5k cases in 2030, I think revenues are somewhere in the $1.9B to $2.0B range with net income margins in the 21-23% range.
Throw a 28-32x multiple on that (EPS would be growing 35% or better)... add back the cash and $TMDX would likely be trading at $320-360 per share... which is 300-400% higher from here over the next ~4 years.
Clearly we need to see if $TMDX can continue to execute at a high level but the upside looks massive if they can.
If you're looking for some healthcare / medtech exposure then I think $TMDX is very compelling at current prices however it's very possible we still have a couple more bumpy quarters ahead of us with depressed margins from the current investment cycle.
I think management has done a poor job this year communicating their spending plans which caught everyone (including the analysts) off guard when Q1 EPS was down significantly YoY but the near term margin compression doesn't change the longer term opportunity... the selloff this year is creating a nice window to accumulate shares at deeply discounted prices. IMO, this stock should not be trading at less than 3x CY2027 revs despite a few quarters of depressed profit margins from bigger investments into R&D, trials and geographic expansion.
I think $TMDX has a shot at $1B revenues in CY2027, if that happens it means revenues would need to grow at 26-27% this year and 30-31% next year... I think it's doable with all the new products/catalysts on the horizon which should accelerate growth in the coming quarters.
If $TMDX does re-accelerate growth and is on track for $950M to $1B revenues in 2027 and $1.2B to $1.3B revenues in 2028 then we probably see the stock re-rate to 5-6x NTM revs which would put the stock back at the ATHs ($177+) within the next 18 months.
$SKHY SK hynix, I'm quoting Micron $MU as these two are almost interchangeable.
Napkin math:
• IPO price: $149/ADR
• First trade: $170
• Market cap at $170: ~$1.27T
• Q1’26 revenue run-rate: ~$140B
• FY2028 modeled revenue: ~$478B
• Q3’27 target: ~$473/ADR
• Upside from $170: 2.8x
1/ SK hynix is the world’s largest HBM producer.
This is an ADR offering from an already-public Korean company. $SKHY gives US investors direct access to the memory supplying $NVDA and $AMD AI accelerators.
2/ AI compute is increasingly constrained by memory bandwidth.
A faster GPU accomplishes very little when its data cannot reach it quickly enough. HBM stacks memory beside the accelerator and feeds it several terabytes per second.
No HBM, no AI cluster.
3/ SK hynix controls the bottleneck
• ~57% HBM market share
• Primary HBM supplier to $NVDA
• HBM4 already production-ready
• Customer-specific HBM4 logic dies
• Capacity effectively sold out
• 3–5 year customer commitments
-=-=-=-=-=-
HBM4 can no longer be swapped between suppliers like commodity DRAM.
-=-=-=-=-=-
4/ The IPO structure
• 177.9M ADRs issued
• $149 per ADR
• $26.5B raised
• 10 ADRs = 1 Korean common share
• ~2.4% dilution
• Offering was 7x oversubscribed (that's almost $200b in purchasing interest!)
• $SKHYV today, $SKHY Monday
The proceeds fund new fabs and $ASML EUV equipment.
5/ Q1 2026 financials
• Revenue: ₩52.6T, +198% YoY
• Operating profit: ₩37.6T, +405%
• Operating margin: 72%
• Net cash: ~₩35T
Q1 was expected to be the weakest quarter of the year.
This is memory pricing flowing almost directly into profit.
6/ At $170, $SKHY has a ~$1.27T market cap.
My Q3’27 earnings window contains ₩443T of forward-four-quarter operating profit.
Using 12x OP and the post-offering share count produces a ₩7.116M Korean-share target, equivalent to approximately $473 per ADR.
Either the earnings curve breaks or Nasdaq discovers Korean memory math
(my bet is on the dissovery)
7/ The supply chain
$NVDA / $AMD / $GOOGL accelerators
→ HBM4 from $SKHY
→ Custom logic base die from $TSM
→ EUV capacity from $ASML
→ Advanced bonding from $BESI / $042700.KS
Primary competitors: $MU and Samsung.
8/ Risks
• Memory prices have already risen roughly 4x
• Samsung and $MU are closing the HBM4 gap
• Gross margins above 85% cannot persist forever
LTAs and prepayments lengthen the cycle. They do not eliminate it (although this is up for debate as well)
9/ Catalysts
• Permanent $SKHY ticker begins Monday
• Potential semiconductor-index inclusion
• Passive and US institutional inflows
• HBM4E samples and 2027 production
• M15X pilot production in November
• Yongin capacity beginning in 2027
• Quarterly pricing and margin prints
Americans now have access to one of the best semiconductor companies in the world. Congrats!
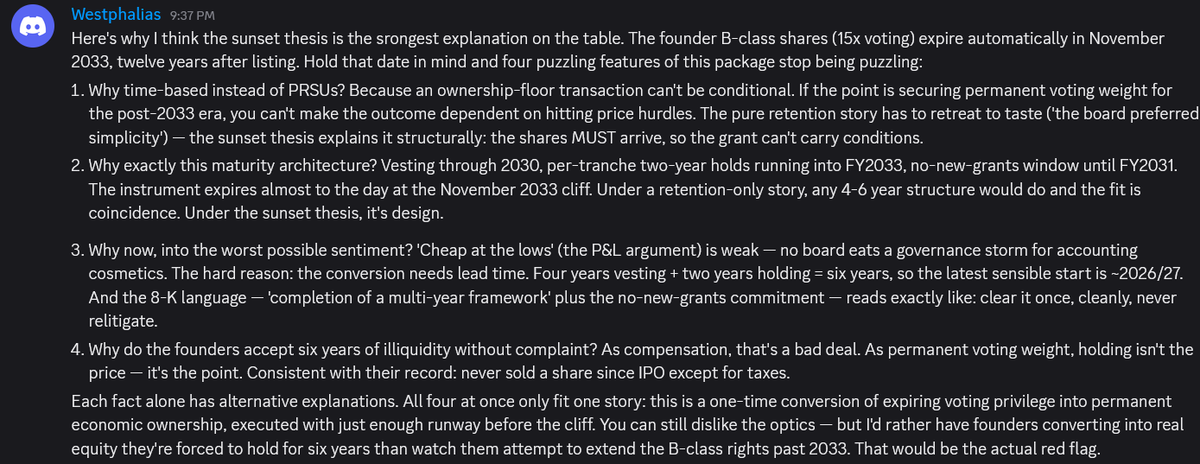
This is one of the more interesting explanations I've seen for @IREN_Ltd 's RSU package as it provides a logical explanation for why the package was structured this way.
@Andreas_Knopf thank you for sharing it on @Agrippa_Inv Discord group!
Curious what others think. $IREN
5/ Learning #2: delayed gratification is the whole game. The gains aren't made at the buy, they're made in the holding, through the drawdowns that shake out everyone playing a shorter game than you. IREN roughly tripled in about three months last year. I'd have missed it flinching.
But conviction isn't blindness, that's how people blow up. So I wrote my exits in advance, calm, before the market tested me: Microsoft pausing, a structural revenue miss, dilution without matching contracts. None have fired. @jiahanjimliu was a great help, and so was my IREN community
Every couple of months I post our top positions at @FirstWaveFund and since we sent our May investor letter a few days ago I don’t mind sharing those positions... here are the top 12 in alphabetical order:
AAOI, ALAB, APP, CRDO, HIMS, HROW, IREN, MELI, MU, NBIS, RDDT, TMDX
All estimates are my own. Every company mentioned in this post has risks so please do your own research and form your own opinions, thesis and conviction. Please don't waste your time asking me where I'd be buying or trimming... because I won't answer.
I spend alot of time building our models and thinking through all the possible variables and catalysts that will impact the reported financials but in reality trying to predict revenues, margins, dilution and earnings in CY2028 or FY2029 is not easy.
$AAOI
CY2025 revenues = $455M
CY2028 revenues = $10.70B
3 year revenue CAGR = 186%
CY2025 EPS = -$0.26
CY2026 EPS = $1.04
CY2028 EPS = $10.40
2 year EPS CAGR from CY2026 through CY2028 = 216%
Currently trading at 15.6x CY2028 EPS (not including cash/debt)
$ALAB
CY2025 revenues = $852M
CY2028 revenues = $3.88B
3 year revenue CAGR = 66%
CY2025 EPS = 1.84
CY2028 EPS = $8.55
3 year EPS CAGR = 67%
Currently trading at 48.7 CY2028 EPS (not including cash/debt)
$APP
CY2025 revenues = $5.48B
CY2028 revenues = $16.67B
3 year revenue CAGR = 45%
CY2025 EPS = $10.64
CY2028 EPS = $37.06
3 year EPS CAGR = 52%
Currently trading at 12.6x CY2028 EPS (not including cash/debt)
$CRDO
FY2025 revenues = $436M
FY2028 revenues = $4.11B
3 year revenue CAGR = 111%
FY2025 EPS = $0.70
FY2028 EPS = $10.68
3 year EPS CAGR = 148%
Currently trading at 25.5x FY2028 EPS (not including cash/debt)
$HIMS
CY2025 revenues = $2.35B
CY2028 revenues = $5.81B
3 year revenue CAGR = 35%
CY2025 EPS = $1.10
CY2028 EPS = $2.55
3 year EPS CAGR = 32%
Currently trading at 13.9x CY2028 EPS (not including cash/debt)
$HROW
CY2025 revenues = $272M
CY2028 revenues = $928B
3 year revenue CAGR = 50%
CY2025 EPS = -$0.14
CY2026 EPS = $1.09
CY2028 EPS = $5.64
2 year EPS CAGR = 127%
Currently trading at 7.6x CY2028 EPS (not including cash/debt)
$IREN
FY2025 revenues = $510M
FY2028 revenues = $6.60B
FY2029 revenues = $9.88B
4 year revenue CAGR = 110%
FY2025 EPS = $0.35
FY2028 EPS = $0.68
FY2029 EPS = $1.33
4 year EPS CAGR = 40%
Currently trading at 45.1x FY2028 EPS (not including cash/debt)
$MELI
CY2025 revenues = $28.89B
CY2028 revenues = $65.81B
3 year revenue CAGR = 32%
CY2025 EPS = $39.40
CY2028 EPS = $90.14
3 year EPS CAGR = 32%
Currently trading at 18.1x CY2028 EPS (not including cash/debt)
$MU
FY2025 revenues = $37.38B
FY2028 revenues = $274.18B
3 year revenue CAGR = 94%
FY2025 EPS = $8.29
FY2028 EPS = $151.32
3 year EPS CAGR = 163%
Currently trading at 7.5x FY2028 EPS (not including cash/debt)
$NBIS
CY2025 revenues = $530M
CY2028 revenues = $22.83B
3 year revenue CAGR = 250%
CY2028 EPS = $5.42
CY2031 EPS = $23.96
Currently trading at 47.8x CY2028 EPS (not including cash/debt)
3 year EPS CAGR from CY2028 through CY2031 = 64%
$RDDT
CY2025 revenues = $2.20B
CY2028 revenues = $6.24B
3 year revenue CAGR = 42%
CY2025 EPS = $4.54
CY2028 EPS = $14.15
3 year EPS CAGR = 46%
Currently trading at 12.3x CY2028 EPS (not including cash/debt)
$TMDX
CY2025 revenues = $605M
CY2028 revenues = $1.34B
3 year revenue CAGR = 30%
CY2025 EPS = $2.63
CY2028 EPS = $6.33
3 year EPS CAGR = 34%
Currently trading at 12.4x CY2028 EPS (not including cash/debt)
NFA.
DYOR.
*I own all of these stocks personally and so does @FirstWaveFund
**If you see any glaring mistakes in my numbers feel free to comment below and I'll double check my work/models.
ENJOY THE LONG WEEKEND.
GO SOCCER!!!!!
$IREN: What to Monitor in 2026
Revenue
No doubt $IREN is rich in power, what $IREN investors need to focus on is revenue. The demand is certainly there, it's about getting GPUs online. Even the rate at which $IREN can sign contract is bottleneck by getting GPUs online because getting GPUs online derisk your ability to meet timelines to sign the next contract.
So what you see in $CRWV is that at the beginning they were really fast and then started slowing down. At first, a Neocloud will 2x revenue every quarter but then the ramp are bounded by the physical world. The benefit of having alot of power is that you'll be able to keep growing at a high rate until you ran out of power or your colocation provider(s) hits their limits. However, that's not $IREN's challenge. $IREN needs to get it's ramp -> cashflow -> ramp feedback loop going. Getting slow GPUs slowed down the whole ramp as you are doing theory based preparation for your datacenter until you get the GPUs and then problems can be uncovered sequentially.
Benchmarks
2024 was $CRWV's ramp year:
Q4 2023: 116m
Q1: 188.7m (+62.7% QoQ)
Q2: 395.4m (+109.5% QoQ)
Q3: 583.9m (+47.7% QoQ)
Q4: 747m (+27.9% QoQ)
Q1 2025: 981m (+31.4% QoQ)
2025 was $NBIS ramp year:
Q4 2024: 37.9m
Q1: 50.9m (+34.3% QoQ)
Q2: 105.1m (+106.5% QoQ)
Q3: 146.1m (+39% QoQ)
Q4: 227.7m (+55.9% QoQ)
Q1 2026: 399m (+75.2% QoQ)
What Will Move the Stock
To look what will move Neocloud stocks, I admit that $NBIS has done a fantastic job this year. What $NBIS executed well objectively was:
1. Sign a 12B Meta Contract with +15B Extension Option
2. Back up their capability to fulfill the contract by hitting revenue numbers and critically showing acceleration in revenue growth. Observe how $NBIS Q1 2026 earnings show an acceleration to 75.2% revenue growth.
I monitor the whole industry to figure out what's going on and for $NBIS, I got to give credit where credit is due, $NBIS put up the GPUs and in this market it doesn't matter if you pay colocation or whatever, getting the GPUs up and showing revenue growth is what the market wants to see from early stage Neoclouds.
IREN's Revenue
IREN's ramp was suppose to start in Q4 2025 but really it's Q1 2026 because we couldn't get GPUs delivered on time due to HBM shortgage which snowballed the whole ramp process back.
Using currently delivery guidance, here are my calculations for the next few quarters revenue:
Q1: 33.6m
Q2: 100.8m (200% QoQ)
Q3: 207.6m (106% QoQ)
Q4: 385.4m (85.6% QoQ)
Q1: 843.8m (118.9% QoQ)
Q2: 1454.7m (72.4% QoQ)
Q1 Calculations: Reported in Q1 earnings
Q2 Calculations: PG exited Q1 with 307m run rate (page 19 of 10Q in source 1 - also screenshotted 1st picture) from the financial digging that @_Sgr_A_Star did and should be at 500m run rate by end of quarter. With linear ramp, (307+500/2)/4-qtr = 100m.
Q3 Calculations: 125m from PG and H1 Handoff stated by Dan to be in Q3 which I will take to be July. I'll take August + Sept of 124m from H1 so 124m * 2/3 = 82.6m.
Q4 Calculations: 125m from PG; 124m from H1; assuming we get Mackenzie handed half way through the quarter = 432.8/4qtr/2-halfway = 54.1m; assuming we get 2/3 duration of H2 and 1/3 duration of H3 and H4 get's handed over at the very end of the quarter, we only count the 2/3 H2+ 1/3 H3 = 124m. Sum = 427.1m
Q1 2027 Calculations: 125m from PG, 485m from H1-4, 108.2m from Mackenzie, CF = 40.6m, half duration of Nvidia Childress site = 85m.
Q2 2027 Calculations: 125m from PG, 485m from H1-4, 108.2m from Mackenzie, 40.6m from CF, 170m from Nvidia Childress, 1/2 duration of Block 7-9 is 330.9m, SW1 50MW IT is 195m
Share Price
IREN's ramp started late but having the power supply abundantly clear, means that the ramp can sustain high % growth for longer because power is not the bottleneck.
If IREN can have report 385.4m quarterly revenue for Q4 2026 it will mirror NBIS 399m quarter where most of its revenue was either H100/H200s and bare metal to MSFT with colocation payments so margin are similar. With an SW1 contract in hand, it would match the Meta 12B with potential 15B extension contract NBIS has. In this case, market is giving NBIS an 55B valuation.
Let's give 5B for NBIS 25% Clickhouse stake at 20B next round valuation even though at 15B valuation now. The rest of NBIS's subsidiary + the power they secured is rough equal to value of IREN's power portfolio (I know must IREN investors wouldn't make this trade off let's just call this even to make comparisons easy, you can do whatever adjustments you want). IREN Q4 2026 report will be which would be 50B (current NBIS market cap) / 22.89B (current IREN MCap) * 64.07 (current IREN stock price) = $139.95/share. Q4 earnings is early Feb 2027 but IREN also has higher sustain revenue growth rates due to it's power abundance but since Q4 earnings is Feb 2027, let's take 20% of for the time delta between EOY 2026 and earnings report for Q4 2026 to have a target of $111.96 share price for EOY 2026.
The really strong year for IREN will be 2027 as it sustains high growth rate and not be stuck in early ramp pains.
Sources
(1) https://t.co/Cd3HLFXzzY
$IREN: Financial Model 2.0.0
https://t.co/cNsypVJ1or
Summary
With more data from IREN's Q1 earnings call on buildout cadence (1), I made significant changes to the 1.2.5 financial model so this will be the first 2.0.0 version.
True to the ethos of the original model, the App allows the user to input all relevant variables and expose the App's calculation details in real time so that the user can audit and provide feedback.
Charting
As a corollary to the guidance on buildout guidance, we are able to implement great suggestions from @StockAnalystPro to chart "share price" vs "year". Additionally, the X and Y Axises can be selected so you can plot for example "share price" vs "MWs active" or "Earnings before Tax, SGA" vs "Market Cap".
I only read charts for TA. For FA, I'm always read numbers and never charts so there's probably improvements / suggestions that can be applied to improve the charting.
GPU Pricing Improvements
Previously I did improvement as a percentage of contract topline. Thanks to @GlobalCollapse for pointing out that's non-intuitive. I removed the odd mechanism completely and provide a flat GPU pricing for different years. For example I have "B300 - 2025 Pricing" which corresponds to both the unit price and hourly rate and "B300 - 2026 Pricing" correspondingly.
The default GPU pricing are either direct IREN datapoints or linearly extrapolated as described below.
Linear Extrapolation
I do mostly linear extrapolation. For example in the case of GPU pricing, IREN always gives GPU pricing included servers, Inter-rack Networking, cabling costs while publicly available figures are per GPU or per rack. To get IREN's all-in pricing for Vera Rubins I calculate = (IREN's All-In GB300 Price in 2025) * (Market Per GPU Vera Rubin in 2026) / (Market Per GPU GB300 in 2025).
Dilution
$IREN does Convertible Debt for their Datacenter Capex and GPU Backed Debt for their GPUs. Both the datacenter capex and GPU capex are subtracted off revenue before calculating "Earnings before Tax, SG&A". In practice this is equivalent to $IREN using revenue to pay off the convertible debt before it matures. Other Neoclouds like $NBIS also issues convertibles debt since it doesn't immediately count as dilution and can be paid back in cash. CRWV has more corporate debt which has higher interest rate but non-negotiable cash redemption.
On top of that I count 10% dilution per year up to 40% in 2029 to account for slippage in buying back convertibles even with the insurance that IREN buys and cost of site works, misc. In 2030+, cashflow should be strong enough so dilution stays at 40%.
Stock Price
The 2026 ARR supports a stock price of $94.63 while 2027 ARR supports $236.44 even though 2027 having lower PE and more dilution accounted for. This is because IREN has become a priority partnered of Nvidia and will get GPU deliveries that corresponds to their full buildout cadence with buildout guidance of 1210MW by 2027, a big jump from 480MW in 2026.
Important to note is that 2027 buildout will start with contracts signed in 2026 so in H2 2026 we may see partial pricing in of 2027 buildout as contracting gives market confidence on the supply side and concrete pricing.
Delays
IREN's build out cadence is bottleneck by GPU deliveries. Full system test of liquid cooling can only begin once the GPUs arrive so late GPU deliveries means late triaging of liquid cooling bugs. Then stress test networking scripts can only be run for long amounts of time after liquid cooling system is fully validated.
As you can see there is only so much theory preparation you can do. In engineering, debugging the real hardware is a process with many sequential locks.
Other
I'm pretty busy these days so my commentary is incomplete but number savy people like @_Sgr_A_Star, @GyujinAAIG might be able to good commentary on numbers. @_Sgr_A_Star has a great model for very zoomed in tracking of earnings financials that can probably validate or invalidate some elements of my model. I welcome feedback from everyone as that's the point of this open sourced model.
$IREN Thesis: H2 2026 - 2027
Financial Model: https://t.co/cNsypVJ1or
Previous Thesis Review
I'd like to start each updated thesis by reflecting on what went right and wrong on my previous thesis (1) and if the wrongs are being addressed.
Although I flagged HBM as potential trajectory altering bottleneck in February (2), I saw the HBM bottleneck impact as increased Capex but did not foresee the issues arising from delays in GPU deliveries.
You see, GPUs and HBM are co-packaged. This means, Nvidia secures the HBM supply and then TSMC integrates the GPU and HBM into the same package to make a GPU chip. Nvidia then controls the GPU chip deliveries to hyperscalers or server integrators like Dell, SMCI, and Lenovo.
IREN was getting GPUs from both Dell and Lenovo late which actually means Nvidia did not prioritize them. In ramping up a datacenter, there's only so much theory based preparation IREN can do. In hardware engineering, ramp up problems can arise sequentially. Only once you get the a significant batch of GPUs and run them for longer periods of time, do you uncover cooling deficiencies. Only once you get the cooling right, can you run networking stress test scripts. I'm sure IREN had built in slack time to mitigate delays but there's no mitigation for GPU deliveries arriving months late. Thus we have seen a painful revenue ramp for IREN in H1 2026.
For 2027, the largest change was that Nvidia and IREN formed a strategic partnership to accelerate deployment of AI Infrastructure (3). Contract wise, this is written has Nvidia gets options to buy IREN at $70 vesting upon "Nvidia GPU infrastructure is deployed across IREN campuses and only fully vest upon deployment of 600k GPUs" (6:40-6:55 of 4). However, for Nvidia, these options aren't the true motivator, but rather it's about expanding their ecosystem as I will explain later.
For H2 2026, the change will be that B300/GB300 production will be fully ramped. In 2025-H1 2026, beyond the unprecedented demand, exacerbating the demand-supply imbalance was that the B200/GB200 was a smaller generation of GPUs compared to H100/H200 and B300/GB300 because the Blackwell ramp had faced technical and supply chain challenges (5).
Demand Review
In early February, I identified that Anthropic would release unprecedented growth numbers would result in urgent GPU demand (6). While the demand from Anthropic has played out, Anthropic subsequently signed with everyone possible from CRWV (7), xAI to Akamai Cloud (8) and Amazon, Google, Microsoft. IREN opted to make their flagship SW1 campus be Vera Rubins rather than GB300s but I will explain why this is a prime site for Anthropic.
The Core Thesis
Every AI thesis should be firmly grounded on roadmap and incentives of the AI Hyperscalers: Nvidia, Anthropic and OpenAI.
The previous generation of Hyperscalers followed the Amazon model: excel at cloud infrastructure for in-house projects and provide managed software services for enterprises applications.
The AI generation of Hyperscalers will follow the Anthropic model: excel at agentic AI that builds software in house and provide agentic AI for enterprises to build vertically integrated applications and tailored software infrastructure.
Why vertically integrated applications and tailored software infrastructure? Contrary to misconception, AI does not make SaaS obsolete but rather raises the bar for SaaS. Just like how excelling at Leetcode and reading DDA is no longer sufficient for software engineering interviews, application level software is no longer sufficient for SaaS companies.
We saw the following business solidify their moat through vertically integrated applications and tailored software infrastructure:
2000s: Amazon, Google
2010-2025: Meta, Netflix, Uber, Salesforce, Airbnb, TikTok, Palantir, Tesla.
In the 2026-2030 AI will enable smaller teams to output more software and having vertically integrated applications and tailored software infrastructure will be a requirement of SaaS companies to have proprietary services and squeeze out optimizations. In other words: if you've played around with Claude Code at all, you will know that application level software by itself is not a differentiated business.
Beyond the OpenAI and Anthropic, there will be a important role for open source and custom models. However, generating application code and connecting it to Token APIs will not be a differentiated business. The margins will come from optimizing the inference stack based on application call patterns down to bare metal. Some companies like Cursor and $TEM have gone as far as building their own custom models to derive proprietary differentiation and accrue margins.
Open Source Models
Open Source will be important. Open Source Models will be like Linux: very important but optimizing Linux is not a big business. Many leading enterprises have in-house customized distributions of Linux optimized for their workloads.
While there is alot of chatter about how Anthropic and OpenAI Token cost have become borderline untenable (9), the thing you have to understand is that Anthropic and OpenAI are building a ecosystem not a token generator. If Open Source takes significant enterprise market share because it's cheaper, Anthropic and OpenAI will have different tier models on the cost curve. Both Anthropic and OpenAI need high market share to achieve economics of scale and form an ecosystem. They already have cost tiered models but if Open Source starts to take significant enterprise market share, OpenAI and Anthropic will get more aggressive.
Let's me put it another way: principal engineers at Google are using Claude Code to build GCP (10). Claude Code is improving rapidly. Do you think the AI Natives and Leading Enterprises of tomorrow will build their own software infrastructure or pay out 80% margins to Neoclouds?
IREN's Role
I see IREN's software acquisitions in Mirantis as a 2-3 year stop gap while AI Natives and Leading Enterprises ramp up on AI while Claude Code continues to improve.
In the age where Nvidia/Anthropic/OpenAI are the Hyperscalers, I see IREN as the Exxon ($XOM). XOM does alot more than producing oil and gas, they do all the downstream work to refine, distribute and create chemcial dervatives of oil. Likewise, IREN has the expertise to do power studies to secure grid connected power and build out power infrastructure but vertically integrated in the sense it does datacenter design, datacenter operations for hardware uptime, and managed Kubernetes.
Some who are trying to invest in Neoclouds as an AI play are ignoring the risks of how AI will disrupt software. AI does not make software obsolete at all but it increases the software which leading enterprise will have optimized in-house. There will be many successful Colocation providers and Neoclouds but IREN unique in that it has more vertical integration than colocation providers (CIFR, WULF, HUT) but without higher valuation premium for the software layer (CRWV, NBIS) primed for disruption and more grid connected power secured than anyone else outside the old HS.
Other Neocloud investors may say electricity is cheap but once you look $BE, you realize secured power is valuable. The margin which other Neoclouds like $ORCL and $NBIS give up to BE is margin advantage for $IREN. In other words, with 4.9GW of secured power and multi-GW pipeline, $BE and $IREN have a shared-factor exposure to power but with $BE market cap at 86B, IREN's power component isn't properly valued yet.
Anthropic/OpenAI as Foretellers of Software in the Age of AI
Just how Amazon pioneer web architecture which became the forerunner runner of managed services, Anthropic and OPenAI are the pioneers are AI driven software development and serve as guidance of how the software landscape will develop in the next 5 years.
Those who think Anthropic is depending on AWS, CRWV or god forbid Akamai for Cloud Infrastructure don't understand that Anthropic is the best software company on earth. Prior that title belong to Google who developed all their software infrasturcture in house. Anthropic was recently hiring for engineers for ROCm (11), this shows that Anthropic is developing their entire inference stack down the AMD GPU. You bet that already have optimized inference and training stacks for Nvidia GPUs if they are already working on porting it to AMU GPUs.
OpenAI is partnering with Dell to bring Codex to on-prem (12). On-prem means deploying Codex to an enterprise's own datacenter. Clearly this means OpenAI has their own inference stack. There's no reason for OpenAI to make this an Dell exclusive, OpenAI will allow enterprises to deploy Codex onto bare metal as this allows them to expand their market share beyond their allocated compute. This will be a tool as they fight Anthropic and Open Source for market share.
The takeaway is that Anthropic and OpenAI have optimize their model, inference stack, and workload orchestration all the way to the accelerator. Anthropic and OpenAI will be running optimally whether on CRWV, NBIS, or IREN bare metal GPUs. No matter if you are on CRWV, NBIS or IREN bare metal, Nvidia instruction set architecture is the same. For Anthropic who brings their own inference stack, none of the Neocloud software matters.
Nvidia
Now why would Nvidia be incentivize to increase IREN's priority for GPU deliveries? @Agrippa_Inv and @franklee6924T have written extensively about NVIDIA DSX initiative where IREN's SW1 site will the "flagship deployment for Nvidia's DSX architecture but I'll explain it from a historical angle.
Nvidia has extremely well in building a moat from iterating on CUDA, to buying Mellanox to dominate backend inter-rack GPU networking, to buying Groq for low latency inference. However Nvidia has a key risk as long as AWS, Azure, GCP own the customer relationship, the risk of these Hyperscalers developing their own ASIC is always there. Granted these ASICs are not immediately threatening to Nvidia, Jensen works on long foresight and prevents threats before they rise.
Jensen practically brought up CRWV to hedge against the Hyperscalers and then gave strong backing to NBIS. Now, it's strategic parternship with IREN is the third leg to hedge against the trio AWS, Azure and GCP.
In the 1990s, Wintel (Windows Intel) dominated the margins. Echoing Andy Grove's strategy of commoditizing your complement, Nvidia is trying to commoditize the current hypperscalers. IREN might yet be the best match for Nvidia strategy because it's about monetizing power at scale and not trying to grow margin on the inference stack. In other words, Nvidia is the modern day bigger Intel, Anthropic/OpenAI are the modern day bigger Windows/OS X, and IREN, CRWV, NBIS are the modern day bigger Dell, IBM, Compaq. In the page of AI, infrastructure buildout will be much larger than PC integrators and IREN will be XOM scale DC/IaaS buildout.
Research Posts
Above is the overarching view on the IREN thesis. I have written posts covering individual components of the IREN thesis and will continue to cover developments.
Financial Model: https://t.co/kk5RuXkg6A
Power Bottleneck: https://t.co/BLDcv4odis
Value of Secured Power: https://t.co/Tq3C4ZsXbw
IaaS and PaaS Markets: https://t.co/lZ3gBigik5
Why AI Research Breakthrough that drastically Reduces Need for GPUs is Highly Unlikely: https://t.co/iefzZ18GhW
Edge AI: https://t.co/ppSa7MNiiq
Netflix Case Study: https://t.co/8II8eRJHXf
Open Source Models on Open Sourced Infrastructure: https://t.co/mo4sNFNXbi
Mirantis Strategy: https://t.co/l1Tx3jVmpR
Mirantis Technical Capabilities: https://t.co/r0miDdCcGd
Mirantis Sovereign AI: https://t.co/ezva8bwmZZ
Datacenter Vertical Integration: https://t.co/OcSbKsylY2
Hybrid DLC + RDHx Cooling: https://t.co/C2fD6gNa9K
Credits
X accounts actively posting IREN Research that I read:
OGs who research I've read from $5:
@FransBakker9812 - analyzes everything IREN including satellite images, documents for powered land developments, and site employee hearsay for his sub group
@Agrippa_Inv - the cleanest thesis and long form research
@_Sgr_A_Star - gets deep into financial releases
@bitcoinbutcher1 - sunday spaces lead
@Umbisam - risk cautious but not risk adverse insights
@nanotitan28 - doing IREN TA since day 1
Large Accounts with Excellent IREN Coverage
@TheTechInvest - great coverage of Tech Stocks with all in IREN allocation, previously all-in Nvidia
@kevinxu - 8 figure successful investor with high IREN conviction
@moninvestor - small/mid cap specialist who fully understands the IREN thesis
Industry Coverage:
@scludweed/@alanbialo - great repost and who happen to be whales. Not listed here but the biggest retail whale has a bigger allocation than seed investors but shouldn't be revealed for privacy reasons.
@MarkosAAIG - Day 3 NBIS Investor Industry Coverage
@pepe_maltese - Institutional Grade POV
@GlobalCollapse - options dealing
@XCapitalMgmt - the legit account covering IREN with Capital in it's name
@GyujinAAIG - Korean Medical Resident also covering IREN, Semis and Materials
@ilzmcfly - forensic grade digging
@StockAnalystPro - AI Director at MSFT POV
Seed Investors: @BTCYESPLS, @mikealfred, @TheBigDegen, @roberto45580514
$DLO
Seen multiple valuation models on X and Subst*ck. I differ quite a lot in terms of TPV and take-rate, both in opposite directions.
I think people are extrapolating TPV growth to be way slower than it probably can grow at for one reason. IMO, TPV should not be thought of as top-line growth. Instead, because of the standard ramp-up cycle of businesses as they integrate a new payments intermediary like $DLO, TPV is a lagging indicator and leads to prolonged growth.
When a new merchant signs, they typically don't go from zero to full-scale processing overnight as they usually have to integrate it into checkout flow, test specific markets, compare payment success vs incumbents. This is also why $DLO's NRR of 152% appears to be a huge outlier compared to other SaaS businesses.
The flip side is take rate. This is where I'm probably a lot more conservative/pessimistic than most bulls.
I think $DLO's take rates will continue to compress at a similar cadence to what has happened in the past few years in percentage terms. It is pretty clear that large enterprise merchants have huge bargaining power. As they sign more modules and increase TPV flowing through $DLO, they have the ability to negotiate lower take-rates.
It's not necessarily bearish from a fundamental basis as TPV growth will probably still outgrow the take-rate decreases multiple times only.
That said, I do think this narrative ultimately points to lower terminal margins and a lower exit multiple. That is probably the biggest bear case for me.
I have held the stock for about a year now, and it has essentially gone nowhere, so I have clearly been wrong so far. My sense is that this is probably the main reason why.
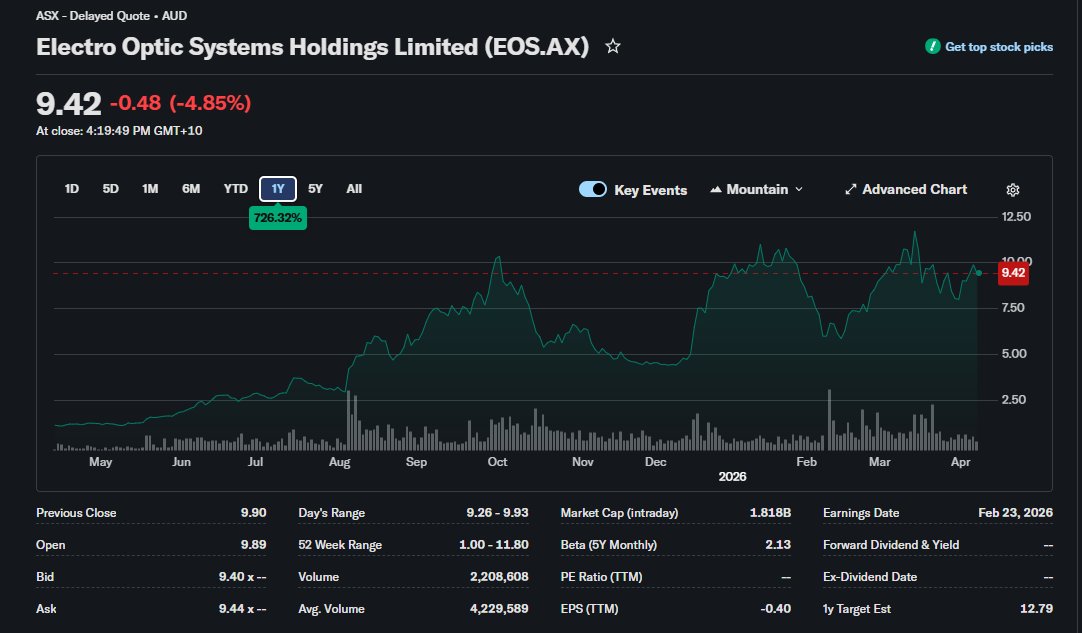
$EOS.AX - The Sovereign Counter-Drone Backbone of the $15B Defence Pivot.
Today, Defence Minister Richard Marles released the 2026 National Defence Strategy (NDS) and the Integrated Investment Program (IIP).
These documents provide the formal framework for Australia’s military procurement over the next decade.
The standout feature is a $15 billion commitment to drone and counter-drone capabilities. Here is how Electro Optic Systems (EOS) aligns with the specific requirements of this new budget.
The $15 Billion Allocation
The 2026 IIP confirms a major funding shift toward asymmetric capabilities.
The Funding: The government has allocated up to $15 billion for autonomous and counter-autonomous systems through 2036.
Immediate Capital: This includes approximately $5 billion in newly allocated or redirected funds over the next four years to fast-track drone defenses.
The Mandate: The NDS explicitly requires these systems to be sovereign-made. This policy prioritizes Australian-owned IP and local manufacturing to ensure supply chain security.
Directed Energy: The Infinite Magazine
The IIP introduces the Infinite Magazine concept (a phrase that EOS coined); a shift away from expensive missile interceptors toward low-cost, repeatable effects.
The Technology: The budget fast-tracks Directed Energy (DE) weapons to be integrated into the ADF within 36 months.
The EOS Fit: EOS’s Apollo is a 100kW+ high-energy laser designed to disable drone swarms at the speed of light.
Cost Efficiency: While a single surface-to-air missile costs millions, an Apollo laser shot costs roughly $2.00 in electricity, solving the economic imbalance of modern drone warfare.
Slinger: Meeting the Mass Requirement
The 2026 budget allocates $3.1 billion specifically for small, high-volume drone threats (CsUAS).
Precision Tracking: Unlike standard anti-aircraft guns, the EOS Slinger uses high-speed tracking software and 30mm proximity-fuzed rounds to achieve a first-round-hit capability.
Vehicle Integration: The IIP funds the hardening of the Army's vehicle fleet. Slinger is designed to be mounted on Australian platforms like the Bushmaster and Hawkei, providing an immediate upgrade path for existing ADF assets.
The Sovereign Advantage
The 2026 NDS sets a strict requirement for Sovereign Industrial Capability.
Local Manufacturing: EOS operates its own production facility in Canberra. This allows them to meet the government's new Sovereign Production Floor mandate, which favors local firms over imported systems.
Global Sales: EOS has already secured export contracts in Europe and the US. This existing commercial scale reduces the first-of-type risk for the Australian Department of Defence.
Current Catalyst: Project Land 156
The funding released today moves Project Land 156 from the evaluation phase into a high-priority procurement cycle.
As the only Australian company with a field-ready 100kW laser and a combat-proven kinetic counter-drone system, EOS is the primary domestic contender for these contracts. 🫦
$EOS.AX is one of my highest conviction positions and one of the largest holdings in my entire portfolio.
Here is a full deep dive on why.
Buckle up.
Most people have never heard of this company. That is exactly the point.
The Origin Story
EOS was founded in 1983 as a partner to Reagan's Strategic Defense Initiative. Star Wars. Laser weapons to destroy missiles from the ground. When that program ended they pivoted to terrestrial defense. Remote weapon systems. Counter drone. High energy lasers.
The foundational IP developed over 40 years of government funded research is irreplaceable and carried at near zero on the balance sheet.
By 2022 the stock was under A$1. Decades of world leading technology trapped inside a company that could not sell it. The founder stepped aside. The company was effectively on death's door.
Then everything changed.
The CEO — The Most Important Thing About This Company
Dr. Andreas Schwer took over as CEO in August 2022.
This is where the comparisons to my other highest conviction positions get interesting.
Arkady Volozh lost everything to Putin sanctions and rebuilt $NBIS from zero. He landed $META, $MSFT, and $NVDA as customers within two years. Abel Avellan built $ASTS from scratch, owns 78 million shares, and has never sold a single one. These are the kinds of people who build generational companies.
Dr. Schwer belongs in that conversation.
PhD in aerospace engineering from Stuttgart, Delft, and ESA. 14 years at Airbus in VP roles. Then Rheinmetall board member, CEO of the Combat Systems Division across 16 countries with 7,000 staff, Chairman of Rheinmetall International. Then he left to become the first CEO of Saudi Arabia's national defense champion SAMI. Built it from zero to a multi-billion dollar company.
Then he looked at EOS, a struggling A$120M Australian company with world class technology nobody was commercializing, and said he wanted to build something of his own.
His compensation structure tells you everything about his alignment. 75% performance based equity. Options only vest if EOS stock outperforms the ASX 200 index by 200%. He does not make a cent unless long-term shareholders make serious money first. No private jets. No lavish spending. An operator through and through.
His quote on competing with Rheinmetall's own laser program against the German government: "We offer double the performance for half the price in half the time."
That is not marketing. That is a man who built Rheinmetall's weapons division telling you exactly what he thinks of his former employer's offering.
The Turnaround Numbers
When Schwer took over in August 2022:
Stock: A$0.80
Market cap: A$120M
Order book: A$50M
Gross margins: ~30%
Balance sheet: debt-laden
Today:
Stock: A$9.20
Market cap: A$1.78B
Unconditional backlog: A$459M (+818%)
Gross margins: 63%
Cash: A$128M. Repaid all toxic debt.
18 contracts worth A$424M signed in FY2025 alone
World's first 100kW laser export contract ever signed
FY2026 revenue guidance: A$180-230M, up 40-79% from last year.
That is what one exceptional CEO does in three years with world-class technology.
What EOS Actually Does
EOS makes two categories of products that are converging into one complete defense platform.
Remote Weapon Systems stabilized gun platforms that mount on armored vehicles and ships. Automated targeting, fire control, all weather operation.
Customers include the US Army, General Dynamics, Northrop Grumman, and militaries across NATO and the Indo Pacific.
High Energy Laser Weapons, the APOLLO system. 30kW, 50kW, and now 100kW variants. Counter drone, counter rocket, counter mortar. $1-10 in electricity per shot. Unlimited magazine. Neutralizes a target in 1.3 seconds. Detection range over 12km.
EOS has never lost a single live fire comparison test in company history. Not against Israel. Not against the US. Not against anyone. Ever.
In the US Army's most watched C-UAS trial in April 2025 EOS won by a large margin. The British government then told its own domestic competitor to go seek a licensing deal with EOS rather than compete.
Why EOS Destroys The Competition
$LASR nLIGHT is the name people compare to EOS.
Here is why that comparison does not hold up.
nLIGHT makes fiber laser components. They are a supplier to defense primes. They do not make finished weapon systems. They do not have fire control. They do not have targeting. They cannot export an integrated weapons platform. They are an ingredient company.
EOS is a full systems integrator. They own the laser. They own the fire control. They own the targeting radar. They own the software. They can tech transfer and localize production in the customer's country.
That is the critical difference. $NOC Northrop Grumman, $LMT Lockheed, and $RTX Raytheon cannot do this because they are ITAR restricted. They cannot transfer the technology to a foreign government's domestic production. EOS can. That is a moat that cannot be replicated by US defense primes.
DroneShield $DRO.AX is the other Australian comparison. Does soft kill electronic warfare RF jamming. Trades at A$3.55B on A$217M revenue at roughly 16x. Soft kill is increasingly ineffective as military drones get frequency hopping and GPS independent guidance. EOS does hard kill. The drone does not survive. No comparison on lethality. EOS trades at roughly 7-8x revenue with dramatically better technology, better margins, and a larger pipeline.
The Contracts The Market Is Mispricing
The Abrams contract with General Dynamics is being priced as a one-off $22 million deal. Schwer said on the earnings call it is "only the very first slice of something which will become very, very big, up to $3 billion over 15 years."
This is platform lock-in on America's main battle tank. Every Abrams in service globally is a potential customer. The market is pricing it as a single contract.
The Netherlands A$125M laser contract is the world's first 100kW export deal in history. ITAR-free. The Netherlands signed because they could not get this technology from a US company. Every NATO nation watching that contract is a potential follow-on customer.
The LAND 400-3 RWS contract in Australia is A$108M. Platform lock-in on Australia's next generation infantry fighting vehicle. Multi-decade relationship.
The Three Catalysts The Market Has Not Priced At All
The 300kW laser. Under active negotiation. Fully customer-funded development meaning EOS takes zero capital risk on the next generation product.
At 300kW the system moves from counter-drone into counter-rocket, artillery, and mortar. The C-RAM market is roughly 10x the counter-drone market. EOS has plans for up to 100 systems at roughly A$100M each. That is A$10 billion in laser revenue potential from a single product upgrade.
MARSS acquisition closing mid 2026. Adds NiDAR AI-enabled command and control software. This transforms EOS from a hardware supplier into a full prime contractor. Pre MARSS they sell subsystems at A$1-5M per unit. Post MARSS they bid on complete integrated defense programs at A$20-100M+ each. Completely different revenue scale and margin profile.
Space warfare. EOS was literally born from Reagan's Star Wars SDI program. Their ground based laser systems can blind, damage, or destroy adversary satellites in low earth orbit. They are the only company outside the US that can do this.
The US Golden Dome program has a $175B budget. Europe is increasingly focused on space domain awareness. The market assigns this capability exactly zero dollars of value in the current stock price.
The Pipeline
A$10B+ total sales pipeline. Active conversations with basically every NATO member. CEO says the Korea 100kW conditional contract worth US$80M is on track to convert to unconditional in Q2 2026. First India sale announced March 2026 a new market entirely. Singapore factory open and operational.
European listing described by management as "very likely" within a year which would unlock institutional European defense capital that currently cannot access ASX-listed stock.
The Valuation Gap
$EOS.AX trades at roughly 7-8x forward revenue with 63% gross margins, a A$10B pipeline, and the most lethal counter-drone laser on earth.
Rheinmetall trades at 16x revenue. Hensoldt trades at 14x. Leonardo trades at 12x. These are European defense primes with far lower margins and no directed energy weapons capability.
If EOS re-rates to 12x revenue on FY2027 estimates the market cap is north of A$5 billion. That is a 3x from here. If the 300kW laser converts and the European listing happens the re-rating argument becomes significantly more powerful.
A$1.78 billion market cap. The CEO who built Saudi Arabia's entire defense industry. The world's most lethal counter-drone laser. Never lost a live-fire test. ITAR-free. Platform locked into the US Army's main battle tank. 63% gross margins. A$10B pipeline.
I am so excited for the future of this stock.
I gave you guys all of those for free.
Here is the next one and I think this could be the biggest of all of them.
$EOS.AX
Australian defense technology company building the world’s most lethal counter drone and directed energy laser weapons. ITAR-free. Never lost a single live fire comparison test in company history. Not against Israel. Not against the US. Not against anyone. Ever.
The CEO is Dr. Andreas Schwer. Former Rheinmetall board member. Ran their Combat Systems Division across 16 countries with 7,000 staff.
Then built Saudi Arabia’s entire national defense industry from zero to a multi-billion dollar company.
His options only vest if EOS outperforms the ASX 200 by 200%. He does not make money unless shareholders make serious money first.
When he took over in 2022: stock A$0.80, market cap A$120M, order book A$50M, margins 30%, toxic debt on the balance sheet.
Today: stock A$9, market cap A$1.79B, unconditional backlog A$459M up 818%, gross margins 63%, zero debt, A$128M cash.
The Abrams tank contract with General Dynamics is being priced as a one-off $22M deal. The CEO said on the earnings call it is the first slice of something worth up to $3 billion over 15 years. Platform lock-in on America’s main battle tank.
The 300kW laser is under active negotiation fully customer-funded. At 300kW the system moves from counter-drone into counter-rocket, artillery, and mortar. TAM expands 10x. Up to 100 systems at A$100M each. That is A$10 billion in potential revenue from a single product upgrade.
A$10B+ total sales pipeline. FY2026 revenue guidance up 40-79%. European listing coming which unlocks institutional capital that cannot even access the ASX today.
DroneShield trades at A$3.55B doing RF jamming. EOS does hard-kill directed energy with better technology, better margins, and a larger pipeline at A$1.9B
The re-rating has not happened yet.
$IREN - Sweetwater 1 - Energization wen?
Iren is nearing the moment of energizing their bulk substation at the flagship Sweetwater 1 site in Fisher county Texas.
What concrete evidence do we have they are close, and what is the current state of development?
Educational post 🧵
My last 10x is about to become my next.
A year ago, I wrote an analysis on $IREN, pointing out why I believed the stock was severely undervalued at $7,62. I argued that in April 2025, Iren was the best risk/reward stock in the market, with the potential to 10x the fastest. Over the next 6 months, the stock did exactly that and 10x. Since then, it has dropped over 50% from its peak (75-35$).
I believe the current pricing of $Iren offers an excellent risk/reward, and I expect the stock to hit $200 during 2027 based on these numbers, assuming a 30 P/E and 50% dilution (409M shares to 614M shares):
1. Annual Revenue (Total ARR = $13.74B)
Canada: $1.5B (160MW) (Conservative imo)
Horizon 1-4 (300MW) (MSFT): $1.94B (Conservative if VR200 gets installed for H3 and H4)
Horizon 5-10 (450MW Air cooled): $4.4B
Sweetwater 1 (600MW of 1400MW): $5.9B
(Assuming GB300 economics, but will probably be VR200 = higher ARR and CAPEX)
2. Earnings (Total EBT = $4.557B)
Canada: $547M
Horizon 1-4: $330M
Horizon 5-10: $1.68B (25% improvement from MSFT deal)
Sweetwater 1: $2.0B (25% improvement from MSFT deal)
3. Net Profit Calculation
Pre-tax Profit: $4.557B (EBT) - $138M (SG&A) = $4.419B
Taxes: $928M (21% Corp Tax) - $789M (85% Tax Abatement/Loss Realization) = $139M
Net Profit: $4.419B - $139M = $4.28B
4. Valuation & Share Price
Market Cap: $4.28B x 30 (Conservative P/E with this growth) = $128.4B
Share Price: $128.4B / 613.7M (50% fully diluted shares) = $209.22
This is with only 1/3 of their announced power portfolio (1510/4500MW). In 2027, they will have over 6000MW imo.
If the company manages to execute, the gains can be massive.
I'm long $IREN and believe this wil be my first 100x stock
What is your price prediction?
$DLO in 2030
Revenue grows from $1.09b today to $2.75b by 2030, a steady deceleration but still healthy. Going from ~27% today 2026 down to ~15% by 2030 (see estimates below).
EPS grows from $0.87 in 2026 to $1.83 by 2030. What matters here is not just the growth (EPS must compound with improving economics and capital return, not just revenue expansion).
Free cash flow grows from ~$190m today to ~$550m by 2030, with growth decelerating from ~30% to mid teens over time. That’s a reasonable progression.
Capital allocation is straightforward. 30% payout, dividends grow from $75m in 2026 to ~$165m by 2030, which gets you to roughly $600m paid out over the period.
For buybacks I am assume 25–30% of FCF, you get ~$500m to $600m of repurchases between 2026 and 2030. Add the already authorized $300m, and total buybacks are closer to ~$800m to $900m by 2030.
But the most important piece is what they keep, the retained earnings. Even after dividends and buybacks, $DLO is retaining roughly 40% of free cash flow. That translates into about $100m in 2026, growing to ~$245m by 2030, and in total roughly $800m to $900m of retained cash over the period.
Today $DLO is worth $4b with no debt and $330m cash. By 2030, before doing anything fancy, you’re looking at a company that has returned ~$600m in dividends, bought back ~$800m+ of stock, and retained close to $1b of internal capital.
And that’s before leverage. This is an asset light, high margin business so 1–2x leverage is not aggressive. That can unlock additional $500m-1b+ capital without putting pressure on the balance sheet.
So the picture by 2030 looks something like this. You have a business still growing double digits, generating over half a billion in free cash flow, returning meaningful capital every year, and sitting on roughly $1b of internal cash.
That last part is what most people are not modeling. Dividends and buybacks are the obvious return. The retained cash and balance sheet flexibility is the additional hidden upside. If they allocate well, through acquisitions or expanding their capabilities, the outcome can end up looking very different from what the base case estimates suggest.
Here are my estimates 👇
(please note these are my guesses and not NFA)
TPV:
• 2025 → $40.8b
• 2026 → $61–65b (50–60%)
• 2027 → $76–81b (25%)
• 2028 → $92–97b (20%)
• 2029 → $106–111b (15%)
• 2030 → $119–124b (12%)
Revenue:
• 2025 → $1.09b
• 2026 → $1.39b (27%)
• 2027 → $1.72b (24%)
• 2028 → $2.05b (19%)
• 2029 → $2.4b (17%)
• 2030 → $2.75b (15%)
Gross Profit:
• 2025 → $403m
• 2026 → $500m (24%)
• 2027 → $620m (24%)
• 2028 → $750m (21%)
• 2029 → $880m (17%)
• 2030 → $1.0b (14%)
Operating Income:
• 2025 → $220m
• 2026 → $285m (30%)
• 2027 → $360m (26%)
• 2028 → $440m (22%)
• 2029 → $530m (20%)
• 2030 → $620m (17%)
EPS:
• 2025 → $0.65
• 2026 → $0.87 (34%)
• 2027 → $1.11 (28%)
• 2028 → $1.35 (22%)
• 2029 → $1.59 (18%)
• 2030 → $1.83 (15%)
Free Cash Flow:
• 2025 → $190m
• 2026 → $250m (31%)
• 2027 → $325m (30%)
• 2028 → $400m (23%)
• 2029 → $475m (19%)
• 2030 → $550m (16%)
Dividends (30% payout):
• 2026 → $75m
• 2027 → $98m
• 2028 → $120m
• 2029 → $143m
• 2030 → $165m
→ Total dividends (2026–2030): $600m
Buybacks:
• 2026 → $60–75m
• 2027 → $80–100m
• 2028 → $100–120m
• 2029 → $120–140m
• 2030 → $140–165m
→ Total buybacks (2026–2030): $500m–$600m
→ Including $300m authorization: $800m–$900m total
Retained Cash:
• 2026 → $100m
• 2027 → $130–145m
• 2028 → $160–180m
• 2029 → $190–215m
• 2030 → $220–250m
→ Total retained (2026–2030): $800m–$900m
Balance Sheet & Optionality:
• $1b internal capital by 2030
• + additional capacity from modest leverage over time
By 2030:
• $600m dividends paid
• $800m+ buybacks
• $800m–$900m retained cash
• 2026 EV ~3.5b
I’ll make this a bit more generic and end the way these posts usually do… how does this not work from here? 😂
🌹
< My projected $IREN price target — conservative case >
If $IREN supplies approximately 600MW across McKenzie, Canal Flats, Horizon 5–10, and Sweetwater 1, what would the required CapEx look like?
McKenzie + Canal Flats
110MW, PUE 1.1, IT load 100MW
Available B300 count: ~51,813 units GPU unit price assumed at $70K (based on details of the recent GPU procurement deal)
GPU cost: $3.63B
Retrofit CapEx assumed at $4M/IT MW DC infrastructure cost: $0.40B
= $4.03B
Horizon 5–10
450MW, PUE 1.5, IT load 300MW
B300 GPU count: 155,440 units
GPU cost: $10.88B
Retrofit CapEx at $5M/IT MW (slightly higher given Texas characteristics)
DC infrastructure cost: $1.50B
= $12.38B
Sweetwater 1
600MW, PUE 1.5, IT load 400MW
No precedent for a Vera Rubin contract, so using GB300 as the basis Based on the existing $MSFT contract, ~152,000 GB300 units deployable Assuming GPU prices have risen 20% since the $MSFT contract was signed (originally 76K at $5.8B)
GPU cost: $13.92B
Liquid-cooled DC construction cost also increased from $15M/IT MW to $17M/IT MW
DC infrastructure cost: $6.80B
= $20.72B
Total: $37.13B
Assuming 95% of GPU procurement cost is covered by prepayments and GPU financing — as precedented by the $MSFT deal — at a blended 4% interest rate:
Total GPU cost: $28.43B
5% equity portion required: $1.42B
DC infrastructure also needs to be funded: $8.70B
Total funding required: $10.12B
Convertible notes vs. ATM at roughly a 3:1 ratio (based on precedent): → $7.5B in converts + $2.5B ATM
Under this scenario: Total Debt: ~$38.6B, Equity: ~$5.04B D/E ratio: ~7.66x
CoreWeave is currently running at ~8.9x D/E, so this isn't unreasonable — and since this calculation doesn't account for any operating cash flows from either the data center or BTC business, the actual D/E ratio would be lower.
In other words, instead of panicking about the $6B ATM shelf increase, the right question is: how much of the buildout does the ATM actually cover?
Based on maximum potential dilution from all converts issued to date, there are roughly 410M shares outstanding.
So how much dilution does "$7.5B converts + $2.5B ATM" actually imply?
I can't calculate this precisely, but here's a conservative scenario:
New $7.5B converts structured similarly to the recently-maturing 32/33 converts:
Conversion price: ~$51.88 (25% premium to current price)
Cap price: ~$83 (100% premium)
$2.5B ATM issued in tranches as the stock price rises
As the stock price rises: dilution from cap-exceeded converts increases, while ATM-driven dilution decreases — they partially offset.
Estimated incremental dilution: ~100–150M shares
Conservative case with full dilution of existing converts: 410M shares + 150M new shares = 560M shares
So my core question is this:
If $IREN executes on McKenzie, Canal Flats, Horizon 5–10, and Sweetwater 1's 600MW
How much could $IREN's market cap grow? Will market cap growth outpace dilution growth?
The original $3.4B ARR figure covered Prince George, Horizon 1–4, and McKenzie/Canal Flats.
Now add Horizon 5–10 and Sweetwater 1's 600MW.
Available B300 GPUs for Horizon 5–10: ~150,000 units B300 rental rates are trending up, as visible in attached charts On-demand average recently bottomed around $7.17 Apply a 60% discount ($CRWV) for long-term contracts → Horizon 5–10 ARR: ~$3.7B
For Sweetwater 1's 600MW, applying the same 20% GPU price appreciation used in cost assumptions: → Sweetwater 1 ARR: ~$4.65B
Total ARR once all sites are fully operational:$3.4B + $3.7B + $4.65B = $11.75B
I believe this ARR could realistically hit the books by late 2027 to early 2028.
(My working timeline:
2026: Canadian DCs fully operational + Horizon 1–4 fully operational + partial Horizon 5–10 online
2027–early 2028: Full Horizon 5–10 + Sweetwater 1 600MW operational — build speed accelerates given prior liquid-cooling construction experience; GPU procurement speed remains a variable)
$CRWV is currently trading at ~3.2–3.5x 2026E revenue (forward multiple compressed to reflect high growth already priced in).
$IREN's 2028E revenue floor: ~$11.75B(additional upside exists but excluded here — only the above sites considered)
Applying a 4x multiple (justified by: vertical integration advantage vs. $CRWV, more growth runway remaining vs. $CRWV, cleaner expected debt structure vs. $CRWV):
Market cap = $47B Share count = 560M Implied price target = $83.9
Therefore, evaluating $IREN solely on the execution of the above buildout, my base case price target for late 2027 to early 2028 is $83.9 (some may call this a bull case — I treat it as my base).
Value not captured in the above:
1. Sweetwater 2's 600MW expected to energize in 2028
2. Assumed zero improvement in contract economics vs. the $MSFT deal (important caveat: that contract was signed before any hyperscaler precedent or demonstrated uptime — economics should improve)
3. Remaining 800MW at Sweetwater 1 (frankly, I don't think all 600MW will be contracted on GB300 terms — I used GB300 purely for simplicity; a Vera Rubin contract would imply even greater value)
4. Oklahoma's 1.6GW site, substation energization expected in 2028
5. Horizon 5–10 B300 rental rate floored very conservatively at $2.86/hr — given the current upward trend in rental rates, is this sustainable?
6. The full $10.12B funding requirement is modeled as 100% converts + ATM with zero contribution from BTC or data center operating cash flows — this is intentionally the most conservative possible assumption.
Bear Case Risk Factors
1. ARR-to-revenue recognition timing risk — delays in converting the $11.75B ARR into recognized revenue push back the timeline for applying the target multiple, delaying the intended price target realization
2. GPU procurement timeline risk — failure to secure GPU supply on schedule directly delays price target realization
3. FCF conversion delay risk — the sheer weight of debt obligations may significantly push out the timeline to free cash flow generation
4. Multiple compression risk — some exogenous or sector-specific development triggers a broad de-rating across the neocloud space
5. ATM dilution risk — if the stock price fails to appreciate meaningfully, ATM issuances occur at lower prices, resulting in greater-than-modeled share count dilution
6. Sweetwater 1 contract execution risk — the 600MW contract may not materialize, or may come in at a smaller scale than assumed
7. Timeline deviation risk — the overall buildout and ramp trajectory may not unfold as modeled, compressing or eliminating the assumed valuation upside within the target window
Not financial advice
Feedback welcome. If you spot any errors in the calculations, please call them out.