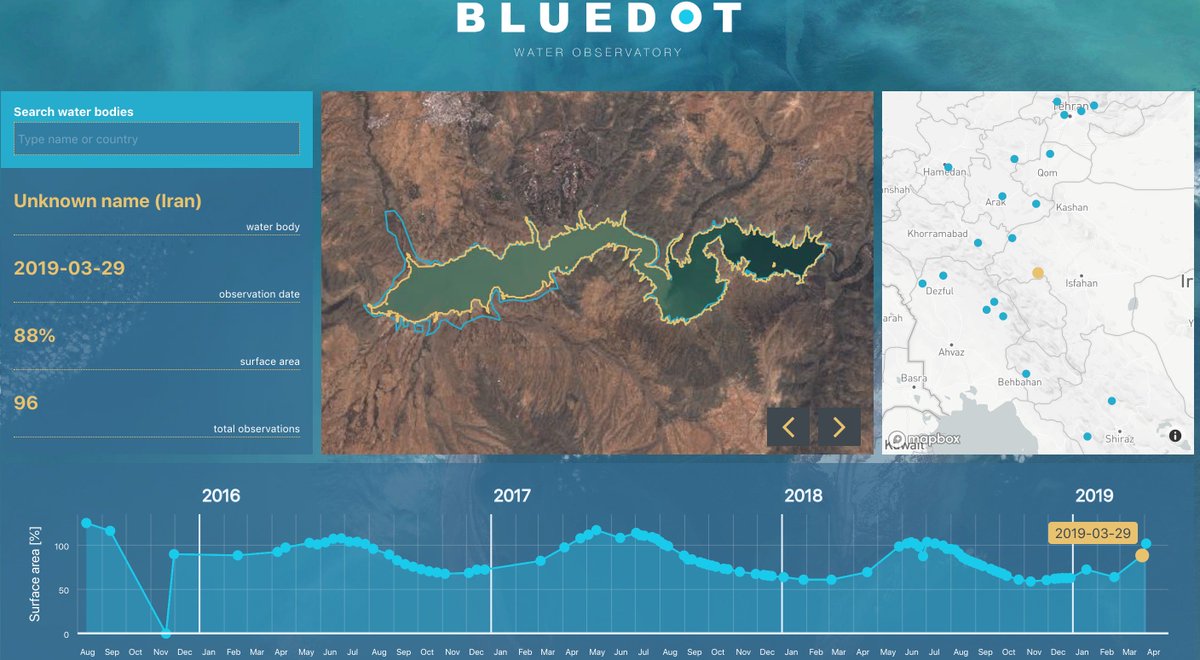
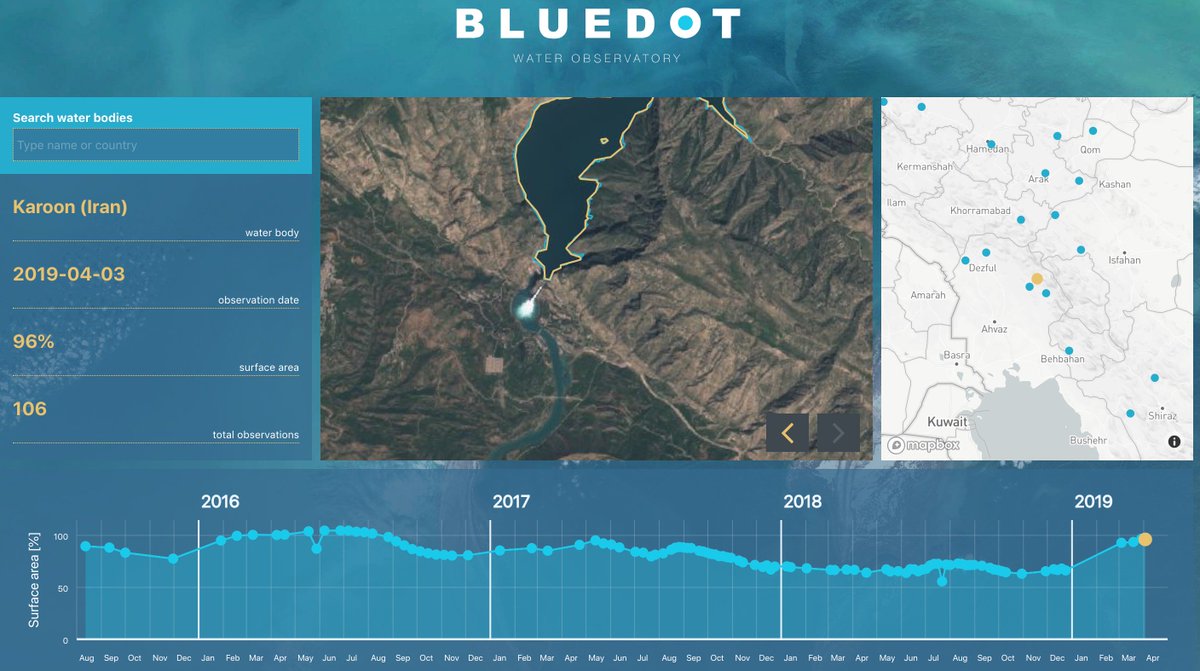
The Water Observatory is an Earth-observation-based solution that provides both global historical and current data on water resources condition utilising #Sentinel2@CopernicusEU open data. The prototype version of dashboard available at https://t.co/USADHIWXiV
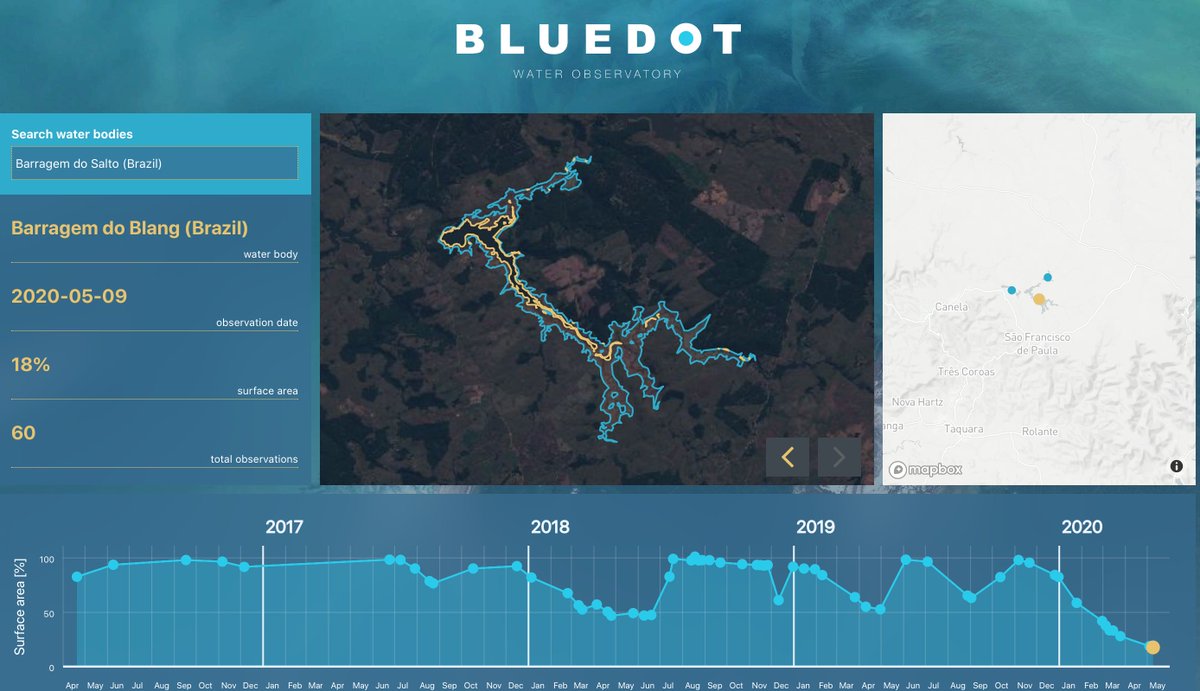
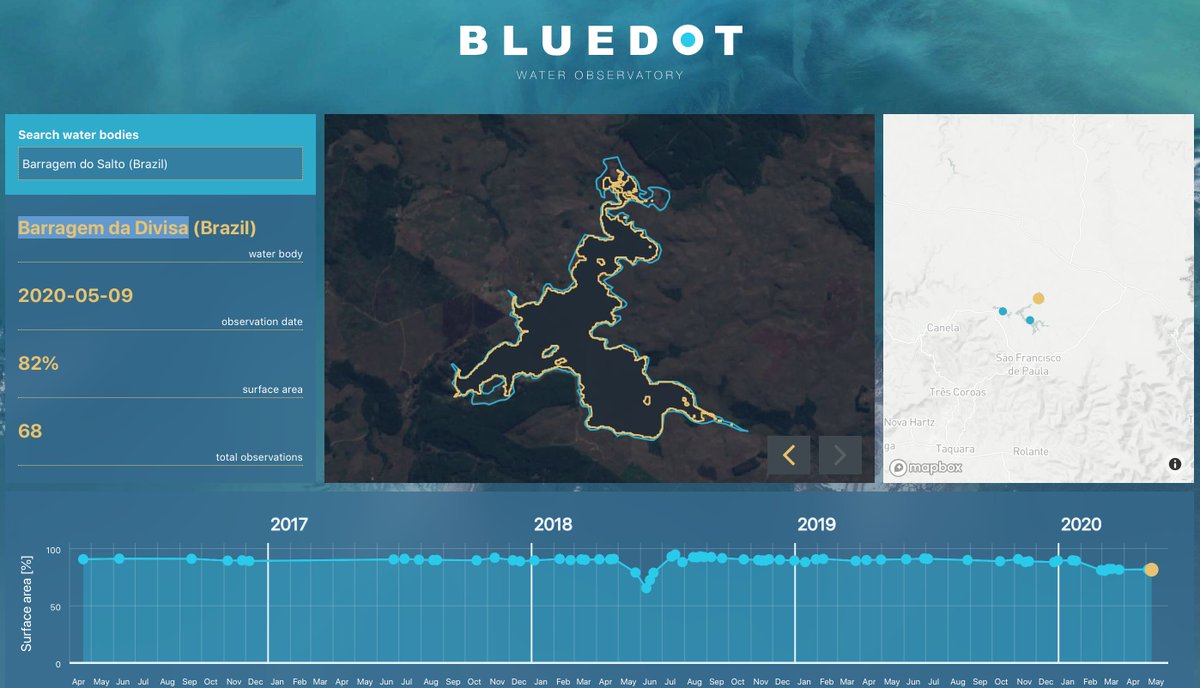
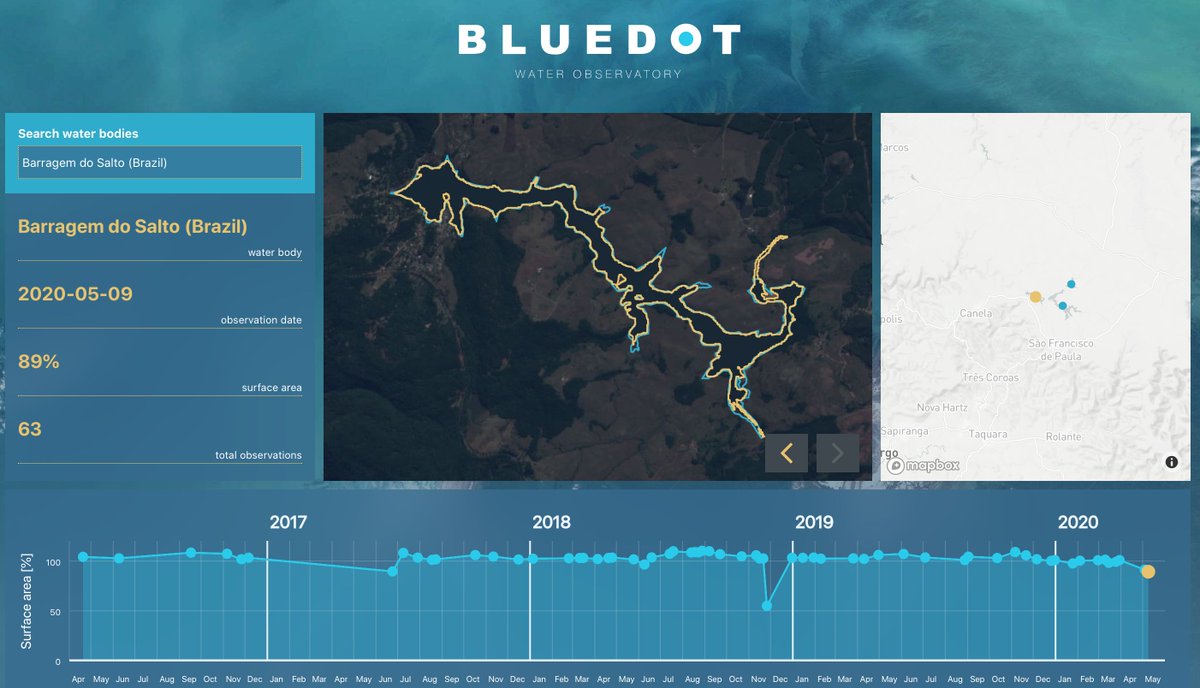
@sergioajv1 Interestingly Barragem do Blang is drying up as can be seen here: https://t.co/pr8a0ZzTym, but Barragem do Salto and Barragem da Divisa nearby seem to be full. Do you know why?
Read a blog post on how to help with improvement of @BlueDotObs water detection algorithms and how to use our open-source #ClassificationApp to crowd-source labeling data for your own use-case. https://t.co/manb4O91KD
@ianschuler@sentinel_hub Love this simple this app is to use. Great example of a web mapping app that balances all the other components on the page and doesn't give all the screen real estate to the map.
The Water Observatory is an Earth-observation-based solution that provides both global historical and current data on water resources condition utilising #Sentinel2@CopernicusEU open data. The prototype version of dashboard available at https://t.co/USADHIWXiV
The answer is of course: yes, it can be done. But one has to forget about tiles (🤔 What is a #Sentinel2 tile?🤷♂️), leave heavy lifting and shoveling of peta bytes of data ⛰️ to the experts like @sentinel_hub and only process (download) what needs to be processed (downloaded).
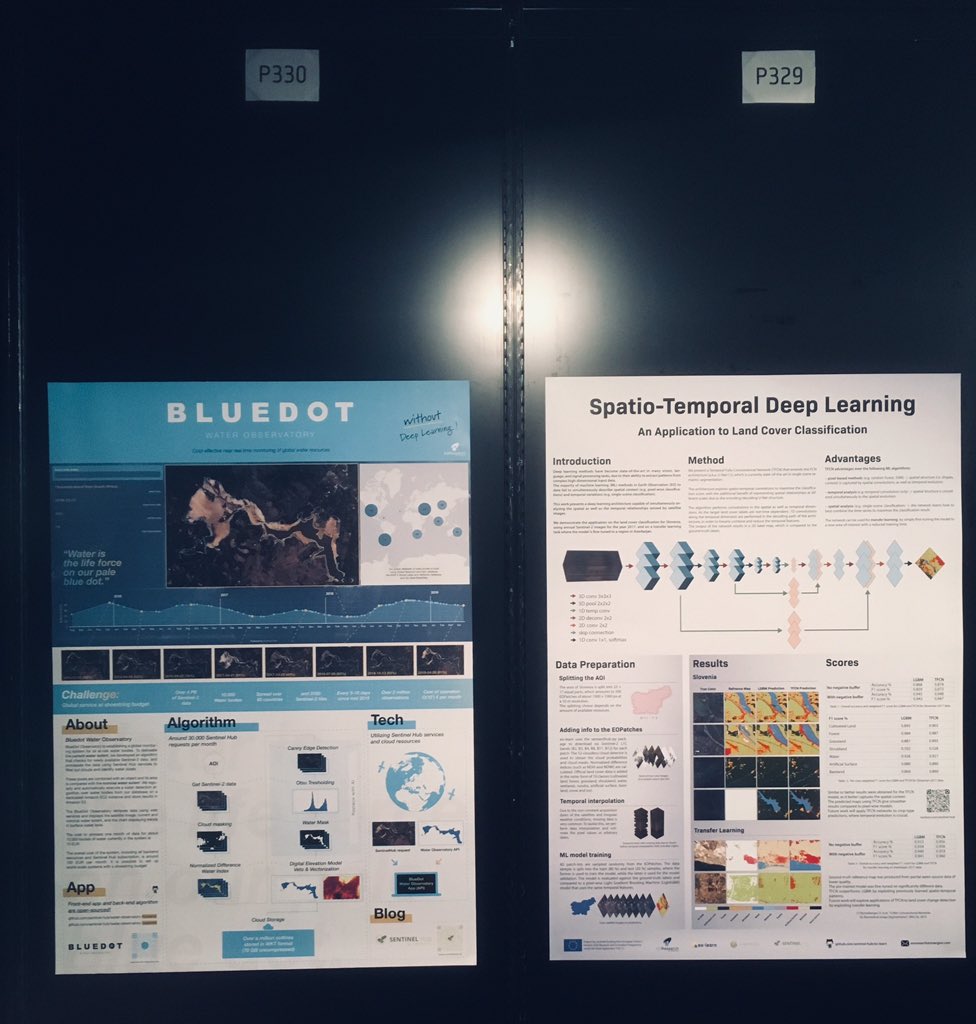
It looks like everyone from Earth observation and remote sensing community is in Milan for ESA's #LPS19 and so are we! Meet us on Thursday at Deep Learning in RS Poster Session: https://t.co/D23vNKKEHg. For those who can't make it ➡️ here's the poster.
Is it possible to run global EO value added service at shoestring budget?
BlueDot's challenge:
🔵 Process 10.000 water bodies spread over 90 countries (🇸🇮🇮🇹🇿🇦🇦🇺🇺🇸...) and 3100 #Sentinel2 tiles every 5-10 days since mid 2015, which accumulates to over 2 million observations!
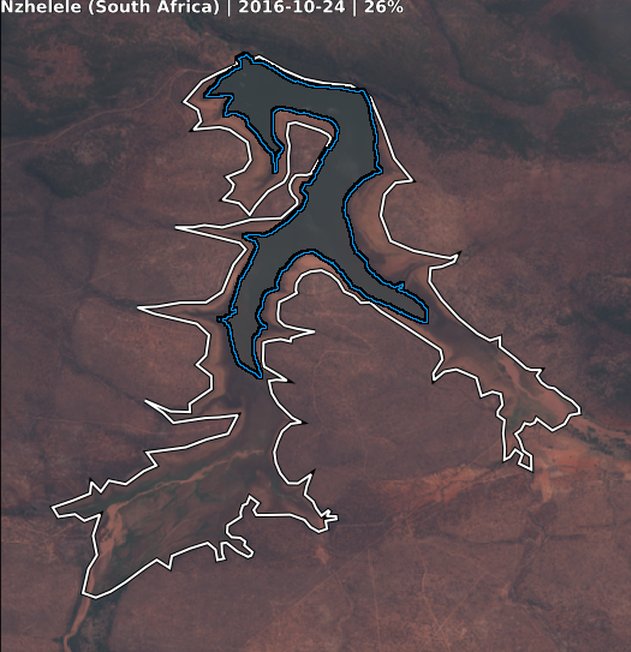
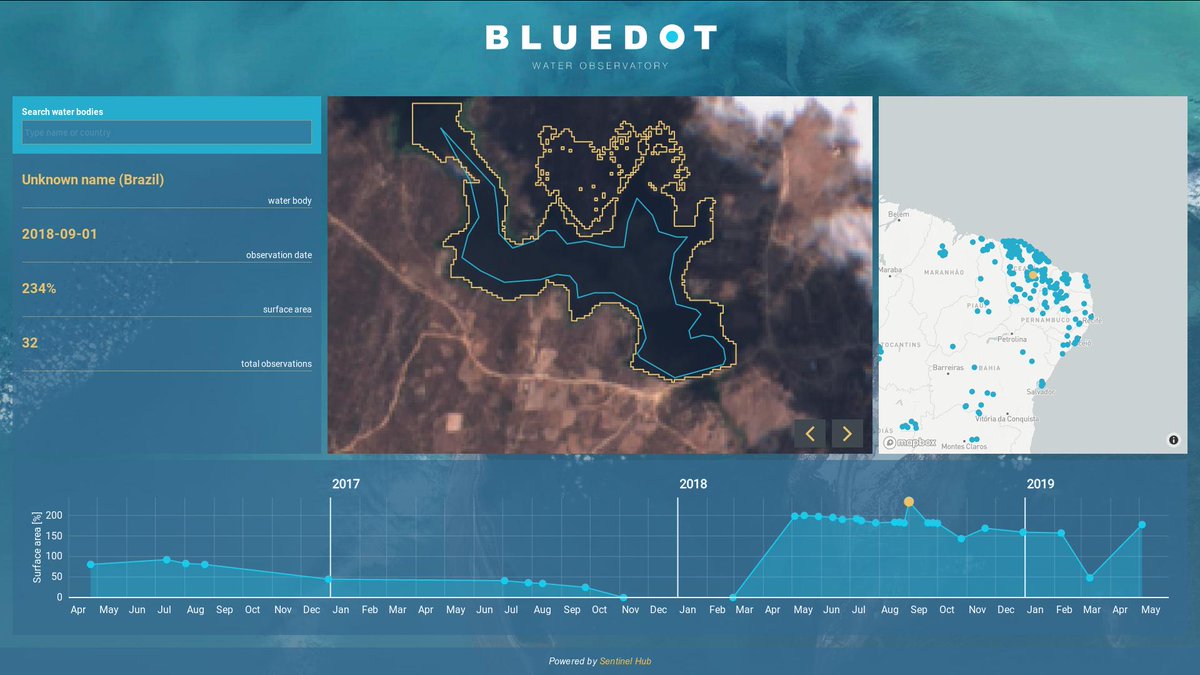
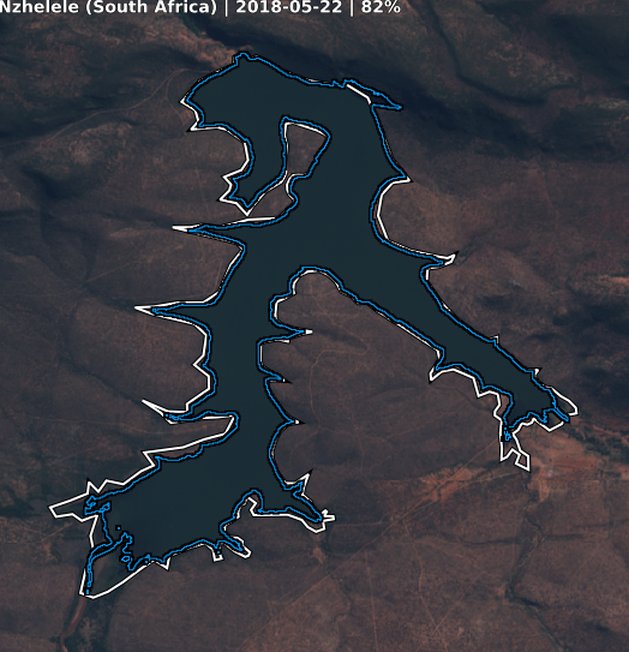
@JDoaim Indeed. Thank you for reporting this. The algorithm clearly underestimates the current water extent for this dam. It's suspected that this is due to the Digital Elevation Model data used by the algorithm. We need to investigate this further.
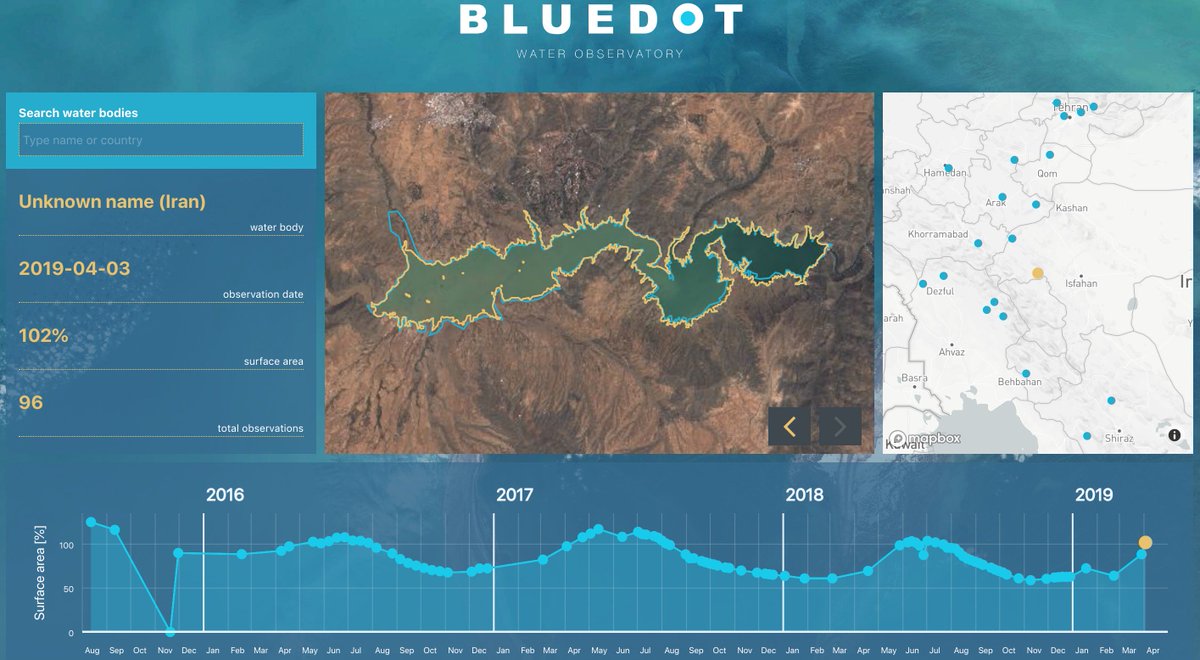
@JDoaim @sentinel_hub The surface of Zayandeh Rud Dam has increased for more than 10% in just 5 days. The discharge of water on Karoon Dam has on the other hand helped to stop the rise of its water levels.
https://t.co/m5B6rJz85h
https://t.co/crUjPQZOLI