Last share of the day:
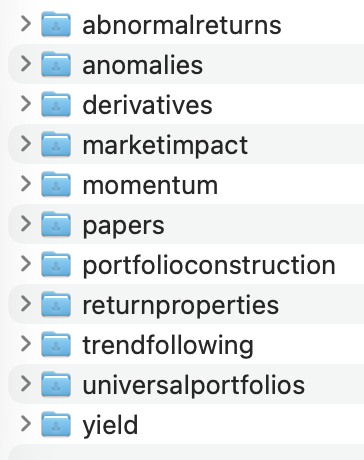
I do have ~10k books & papers on my hard drive. Most are copyrighted, so I can't freely share them. However, I deployed a few agents to summarize them into useful .md files. These are useful for me, and are useful to put in my AI contexts. I am not entirely happy am still working on revising and improving them. They are grouped in the folders below. They are still < 700 items but will grow.
I thought I'd make them available, at least for a while.
Link to shared folder in reply.
Enjoy.
Heads-up: Pre-market so-called “news” or “Truth” is often just a setup for profit-taking. Basically, it’s a reverse indicator.
Do the opposite: If they pump it, short it. If they dump it, go long.
See something tomorrow? You know the drill.
Fracking and horizontal drilling will go down as among the most important - and unlikely — technological achievements of the past century.
We're talking Silicon Valley impact -- had George Mitchell’s crew not used an excessive amount of water one day to fracture rock in Texas’s Barnett Shale—stumbling onto a cheap and effective way to tap oil and gas deep below the surface all over this country — much of the world would be desperate for energy right now— and likely facing severe economic downturns.
A shoutout, too, to Charif Souki, former owner of L.A.'s infamous Mezzaluna restaurant, who convinced Blackstone and others to lend tens of billions so he could build a terminal in Louisiana to export LNG to Europe and Asia. Those continents should build monuments to the LNG pioneers. I can’t imagine where they’d be today without them.
History of western consensus macro econ thought through an FX lens.
A reminder about what felt so certain, but didn't turn out (Japan beating out the US) and what felt so uncertain that seems almost laughable today (that the Soviet economy could beat the US). h/t @krogoff
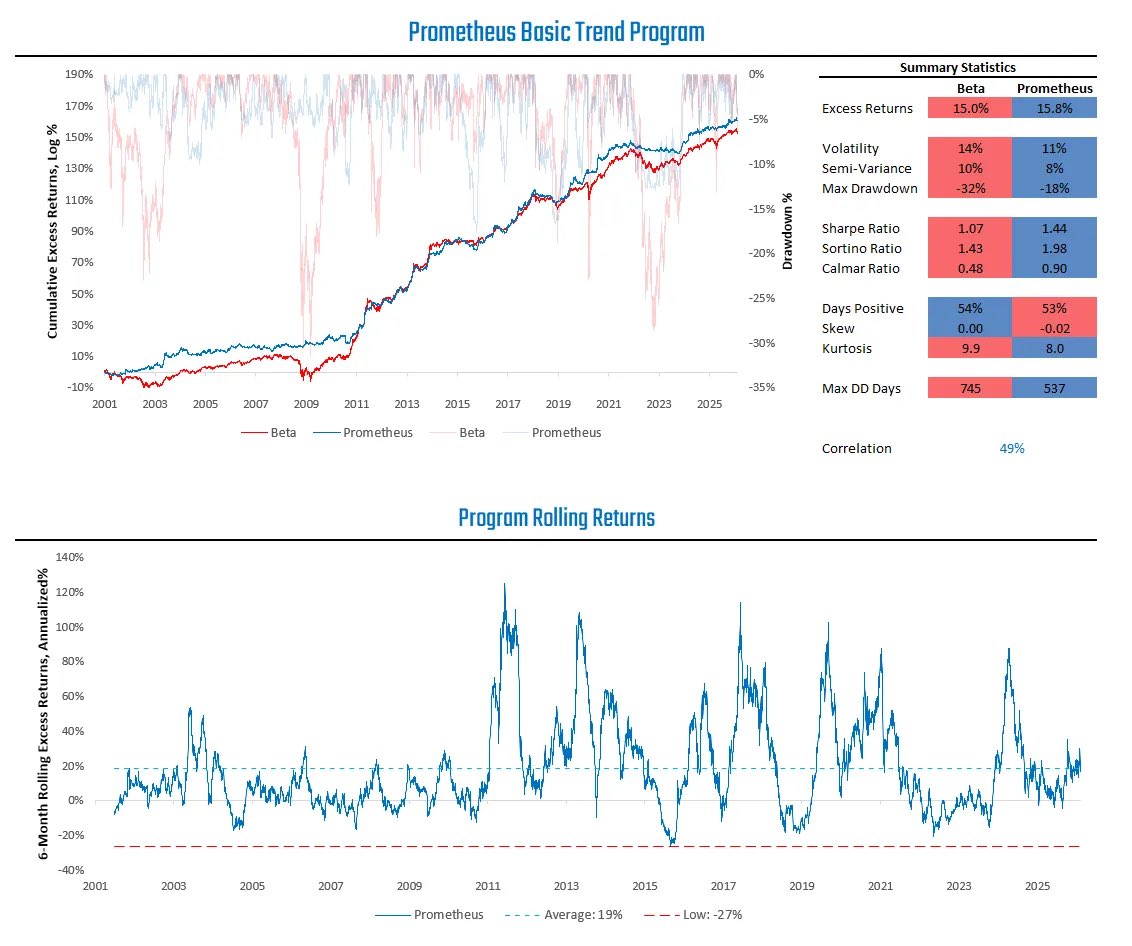
Basic Trend Following: Primer
We’re going to have a more substantive note from @prometheusmacro on how we construct our basic trend program with the empirics.
1/ This thread will focus on the concepts and exact steps to constructing our Basic Trend Program
TLDR: the market expects an extreme level of diversification not just in the SPX but in stock indices around the world.
below, a snapshot of 1m implied correlations. IC is a calculation that falls out of the relative pricing of an index option (like the SPX) and the prices of options on the stocks that comprise the index (NVDA, GOOG, MSFT, AAPL, AMZN, etc).
the index option will always cost more than the average of the single stock options as a result of diversification. some stocks rise, others fall and the index moves are muted as a result. but by how much? IC helps answer that.
when the index option price is high on a relative basis to price of the single stock options, the market is anticipating less diversification. that shows up as a high IC. when the opposite is true - like now - and the stock options cost much more, IC is low as the zigging and zagging of individual stocks is expected to mute/dampen volatility at the index level.
what you can readily see below is that the record setting low implied correlation in the SPX is not just a US thing. it's observable on a global basis. these levels really have no historical precedent to them.
these relative market prices are justified in real time by the extraordinary level of diversification that investors are enjoying by investing in something like the SPX. over the last 12 months, a period that includes the macro shock that was the April'25 "Tariff Tantrum" (h/t @choffstein), the realized level of correlation among stocks in this index is just 15%. that's not far above the correlation between the SPX and TLT of 9%. so as the shock-absorbing role of bonds has faltered, the equity market has internally, magically diversified itself.
while this could easily continue, it's quite plausible that investors are under-estimating the actual degree of risk they are exposed to through broad market ETFs like the SPY.
In the age of LLMs, it is now more and more accessible to create systematic investment processes; but to create one, you need to first be able to describe it.
As I saw on X somewhere recently, the most popular programming language of 2026 is english.
One of the most common question I get is what does a systematic investment process even look like? My goal is for you to understand enough to decide if you want to participate in the markets as a systematic investor.
Systematic investment processes are essentially pipelines that connects data to investment decisions. Every systematic strategy, no matter how sophisticated, follows the same fundamental architecture (with a few adjustments).
Data -> Features -> Signals -> Portfolio -> Execution
I wrote an article that discusses how a beginner might attempt to put this pipeline together so that he may start searching for signals to build his own systematic investment process.
(If you are interested in reading this, I will be giving out free articles to some retweets!)
Ok.. this is, by far, my all-time favorite structured product/derivatives blowup story ever...
This blowup left some decent scars at the large banks, caused quite a headache to exotic/hybrid desks, broke volatility models, and taught an important lesson about cross-gamma...
Interesting. Taiwan dollar has long been deeply undervalued, and many Taiwanese investors have built up large open positions over time and thus are exposed should the TWD rise without any offset from the central bank ...
1/2
@roderix1966@AlfredoMenezes6@RoyalFortune4 Rodrigao, o que seria ficar dado sinteticamente no DDI?
Se o cara internalizou grana fazendo o casado e comprou lft, ele ta dado no DDI, certo? Como ele faria isso sinteticamente?