[New paper] Studies using street view imagery have been confined to driveable roads. We leverage the rarely explored subset of SVI data, e.g. taken in parks and footpaths, to assess the quality of public open spaces. Congrats to Shuting on her 1st paper! https://t.co/cHJ8plenh7
Scientific maps should reach everyone: The cblindplot R package to let colour blind people visualise spatial patterns
Paper: https://t.co/iUsAE2KoEj
Software: https://t.co/pxfJiMJ8cz
#rstats#rspatial#viz#gischat
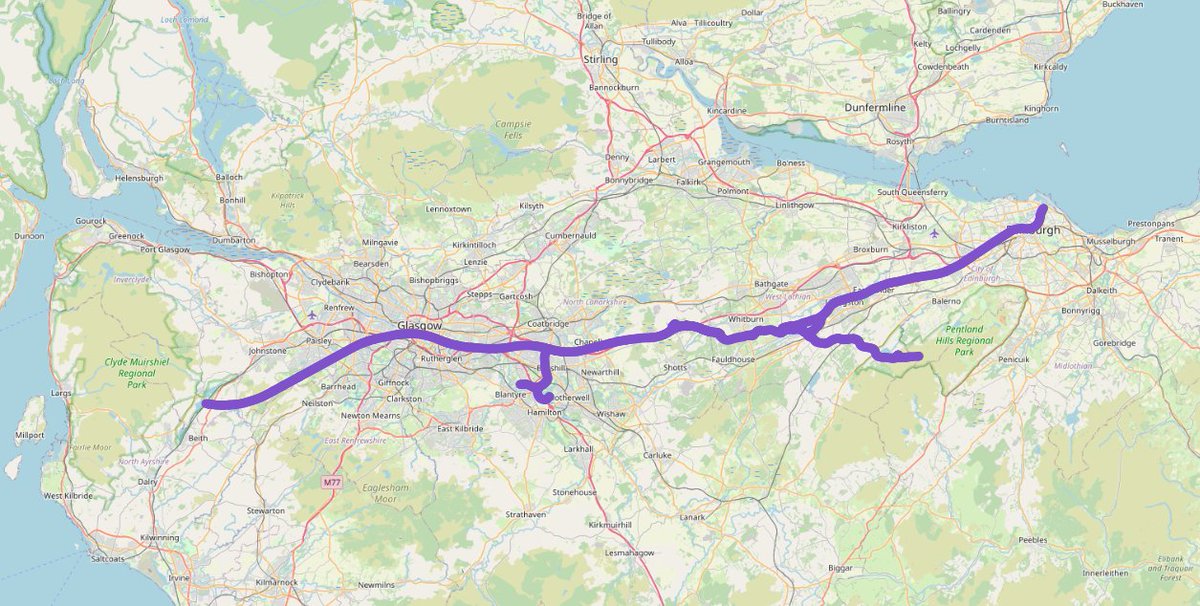
trying to make sense of the bigness of the Elizabeth Line so obviously had to move it north and make some maps (using correct geodesic transformation to account for shifting it northwards, obvs)
@thomasforth I am quite hopeful the current focus is to help rebuild LAs internal capabilities, as shown by recent announcements of £32.9 million for capacity building. https://t.co/bdTRQtY9yH
I've been using the `erase_water()` feature in tigris (#rstats) and pygris (#python) a lot lately to make more realistic-looking maps in water-rich areas like St. Petersburg FL
To learn how to use this feature, register for a free workshop with @UMSSDAN: https://t.co/yvCrvGCOre
@MeganStreb @zoe_billingham@IPPRNorth Would love to work with both of you on this and see how many other transport planners and active travel specialists I work with could help.
@ElaineStead This is excellent. I have literally struggled for years to find enough trained economists that focus on sustainability, environment, net zero and green finance.
Healthy habits can last a lifetime. I’ve spent the morning with children at @LapagePrimary school in Bradford to launch our new early years walking programme in partnership with @livingstreets 🚶
Find out more ➡️ https://t.co/uNXXmt8aC3
@AndyDAgorne@adamtranter I have some wonderful news!
You can find this in the first unit of the Department for Transport modelling guidance. It says in plain English (straight after recommending variable demand models) that modes that ignore induced demand are inadequate.
Source: TAG M1.1



![fbiljecki's tweet photo. [New paper] Studies using street view imagery have been confined to driveable roads. We leverage the rarely explored subset of SVI data, e.g. taken in parks and footpaths, to assess the quality of public open spaces. Congrats to Shuting on her 1st paper! https://t.co/cHJ8plenh7 https://t.co/mQzvOtSyp2](https://pbs.twimg.com/media/FugWUZ6WwAA0U4I.jpg)