Kioxia enterprise SSD shipments are projected by analysts to expand data center exposure to 45% of ¥13,866.0bn in consolidated revenue by FY27, even as near-term guidance stalled at flat quarter-over-quarter volume.
In FY26, analysts estimate enterprise SSDs already account for 40% of Kioxia's ¥9,990.0bn consolidated sales and 40% of its ¥8,067.0bn operating profit, rising to 45% of ¥11,386.0bn in operating profit by FY27. However, July-September non-GAAP operating profit reached ¥1,994.7bn, up from ¥85.9bn a year earlier, before management guided October-December non-GAAP operating profit to ¥2.00trn. That guidance assumes quarter-over-quarter shipment volume will remain flat, average selling prices will increase by only a low single-digit percentage, and foreign exchange will create a 2% to 3% drag. The guided October-December operating profit of ¥2.00trn fell short of the ¥2.32trn consensus expectation, while the stock declined 34% relative to TOPIX between October 23 and November 16. In addition to cautious volume guidance, shareholder returns face near-term delays because Kioxia has accumulated cash on hand while facing an insufficient distributable surplus, making a buyback before the end of 2026 difficult. Although structural enterprise SSD demand underpins medium-term earnings expansion, analysts caution that broader semiconductor sentiment remains sensitive to data center construction delays, power availability, and tighter regulatory scrutiny.
#Semiconductors #Kioxia
Report date: 2026-11-17
When do markets bottom?
Markets bottom not when things look bleak. They do when there is absolute pandemonium.
What indicators are there that can reliably predict a short term bottom?
Here's a few:
$VIX over 30 (at 28 now)
$BPSPX below 40 (at 43 now)
$NYLOWS over 500 (at 400 now)
But the king of them all is the ratio of $NYLOWS to $NYHIGHS.
This measures panic to hope ratio. That is the ultimate indicator. It tells you when there is insane panic and no hope left.
Here's the chart post tariffs low panic. We are there. The reading is at 50 today. RARE.
The bottom is very close. This chart is proof.
If you want to play safe, wait for this spike to disappear. Once the ratio drops below 5, it's safe again.
And if you are like me, this is the time to reshuffle and get on to your fastest horses. Cheers!
Get out NOW!!
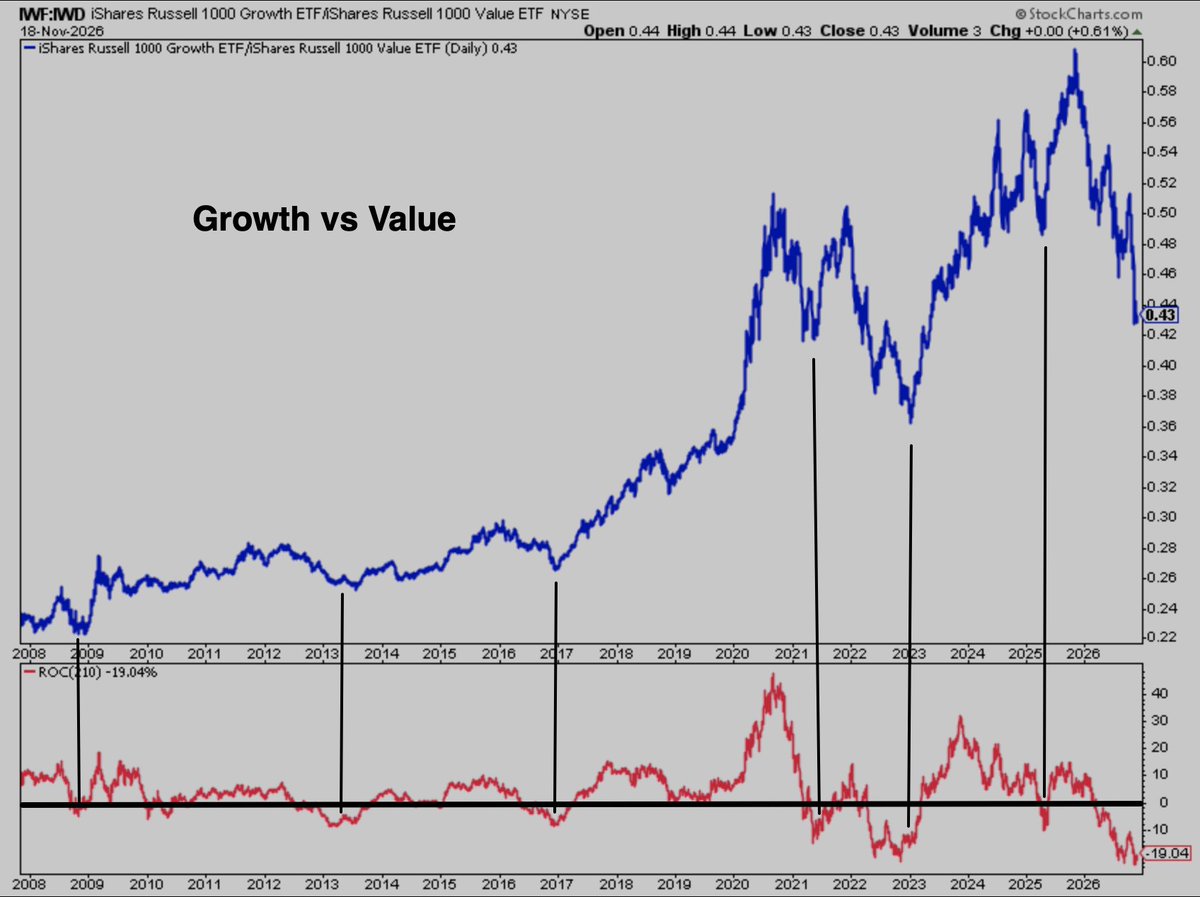
Whenever Value outperforms by this much (n = 2) it has marked the peak in Value trade performance.
Whenever the ratio gets below 0, that's the signal to start getting out of the Value trade and buy cheap Growth, which ALWAYS rebounds, else it wouldnt be Growth.
$SPX $IWF $IWD $QQQ $NDX $MAGS $SPY $IWM $DIA $VTV $VUG $MSFT $AMZN $META $GOOGL
$NKTR has set its own bar for Rezpeg off-drug data and it is below my bar for differentiation as a first-line choice.
Management has now mentioned on three separate occasions (Q3 call, UBS, Jefferies) that about 50% of responders holding EASI-75 12 months after stopping rezpeg would be a success in the Q1 2027 readout.
In my thread I set my bar at Ebglyss, where 66% of responders held EASI-75 nine months after being switched to placebo. If rezpeg clears that at 12 months, it is clearly differentiated imo. At 50% I don’t think you can say that. It would still be a good result, but it doesn’t tell us that rezpeg is more durable than Ebglyss. Beating Ebglyss is where the bigger opportunity is, as rezpeg could then be positioned as a drug that may give patients long remissions off treatment, and that would be a reason to use it as a first option.
Durable responses could support long dosing intervals, but that won’t be unique by the time rezpeg launches, as Ebglyss is already approved for maintenance every eight weeks and zumilokibart has shown activity dosed every 12 and 24 weeks. A case can be made for patients who have already been on a biologic, where its novel mechanism is the argument and infrequent dosing adds to it. But I am skeptical that infrequent dosing positions it as a competitive first option.
Management says the 50% comes from Dupixent’s SOLO-CONTINUE at nine months, and I’m not sure where they are getting that figure from. In the JAMA Dermatology paper, the arm switched to placebo held EASI-75 in 30.4% (24/79), and the arms that stayed on drug held 55% to 72%. It doesn’t change much since their bar is above the real Dupixent number anyway, but Ebglyss is the harder comparison.
No position on Nektar.
That’s bad forecasting because they’re forecasting total NAND prices, which include both consumer and enterprise NAND.
Yes, consumer NAND may get hit because prices are way too high. It’s the same thing with CPUs. Look at Intel. Consumer CPUs got hit, while CPUs for AI are booming.
But keep in mind, NAND is not as important as DRAM for AI right now. A lot of investment is still going toward training. As we shift more toward inference, we’re going to need a lot more NAND.
That’s why I believe NAND will become much more important in 2027, 2028, 2029 and beyond.
This forecast is based on what’s happening right now. In my opinion, NAND demand will accelerate significantly from 2027 through late 2029.
I would expect B300 pricing to continue declining.
A staggering number of neoclouds have approached us @liquidcompute looking to remarket long-term B300 capacity originally committed to Chinese-affiliated offtakers into the US and Western Europe due to concerns of stricter legislation regarding compute servicing to China.
https://t.co/YPnqDRQ5xR
This selloff is worse than COVID + Liberation day
In Goldmans US tech snapshot, clients held $1.5 long for every $1 short, the lowest on record
-if the market rallies into year end trend following CTA can buy back if we get a real uptrend
-hedge funds who have already locked in this year + collect bonuses can chase in January
-Rally could peak in Q1
4.5 sigma corresponds to 99.99932%
3 sigma is usually what is considered an outlier, 99.7%, on an annual basis 3 sigma is one in 300 year event